Charts and statistics
The cluster records its own past without anything installed next to it. Every Master Server and every Chunkserver samples its counters once a minute and keeps the result for years. This page covers what that record holds and how far back each time range reaches. The page also covers what the individual charts count and how to read the same series outside the interface.
Each daemon keeps its own history across restarts
A daemon samples its counters every 60 seconds and dates each sample one minute earlier. The newest point on a chart therefore describes the last completed minute, not the minute in progress. Almost every counter is cleared when it is read. A point is therefore the increase during that minute, not a running total. A chart drawn in two or three shades combines that many series into one picture.
The daemon keeps the history in its data directory, set by DATA_PATH in mfsmaster.cfg and mfschunkserver.cfg: stats.mfs for a Master Server, csstats.mfs for a Chunkserver. Each file has a fixed size and never grows: 9 182 056 B (about 8.8 MiB) for a Master Server and 6 296 272 B (about 6.0 MiB) for a Chunkserver. The daemon holds the same series in RAM. Every daemon has one file of its own. The contents of the file stay local to that process: the history is neither shared nor replicated.
The file is written once an hour, 30 seconds past the hour. A clean shutdown adds the current sample and writes the file again, so an orderly stop loses no history. A daemon killed without running its shutdown path loses up to one hour of history. The daemon writes over the file in place, without a temporary copy, so a machine that fails during the write leaves the file truncated.
At startup, the daemon loads the file and matches the stored series by name. A version that adds or drops a series therefore does not damage the rest. A series that the running version does not have is skipped. A series that was not in the file starts empty. The period between the last stored sample and the restart is filled with "no data" and appears on the chart as a gap. Everything recorded before the stop is kept. The daemon logs stats file has been loaded when it read a file, and no charts data file - initializing empty charts when there was none.
Four time ranges hold the same series
Every series is kept four times, once per resolution, each time in a buffer of 4096 samples. The daemon fills the four buffers in parallel and does not derive them from each other. The daily range is therefore complete even on a cluster whose minute range has wrapped around many times.
| Range dial in the GUI | -r | Time step | How far the range reaches back |
|---|---|---|---|
2 days | 0 | 1 minute | 4096 minutes, about 2 days and 20 hours |
2 weeks | 1 | 6 minutes | 24 576 minutes, about 17 days |
3 months | 2 | 30 minutes | 122 880 minutes, 85 days and 8 hours |
10 years | 3 | 1 day | 4096 days, about 11 years |
Three of the four labels are rounded down and reach back further than they say. The 3 months dial is the exception: 4096 steps of 30 minutes stop at 85 days and 8 hours, a little short of three months.
Counting series are scaled so that they stay comparable across the ranges. In the three longer ranges, the sum collected in one window is divided by 6, 30, and 1440. In the daily range, a chart of operations per minute therefore shows the average number of operations per minute over that day, not the total for the day. Series that record a maximum instead of a sum are not divided and keep the highest value from the window.
The charts sit on the Charts tab
The Charts tab of the GUI has two subtabs, Master servers and Chunkservers. The Master Server charts are on two sheets. You pick a sheet in the selector, with the entries that end in - resources and - operations.
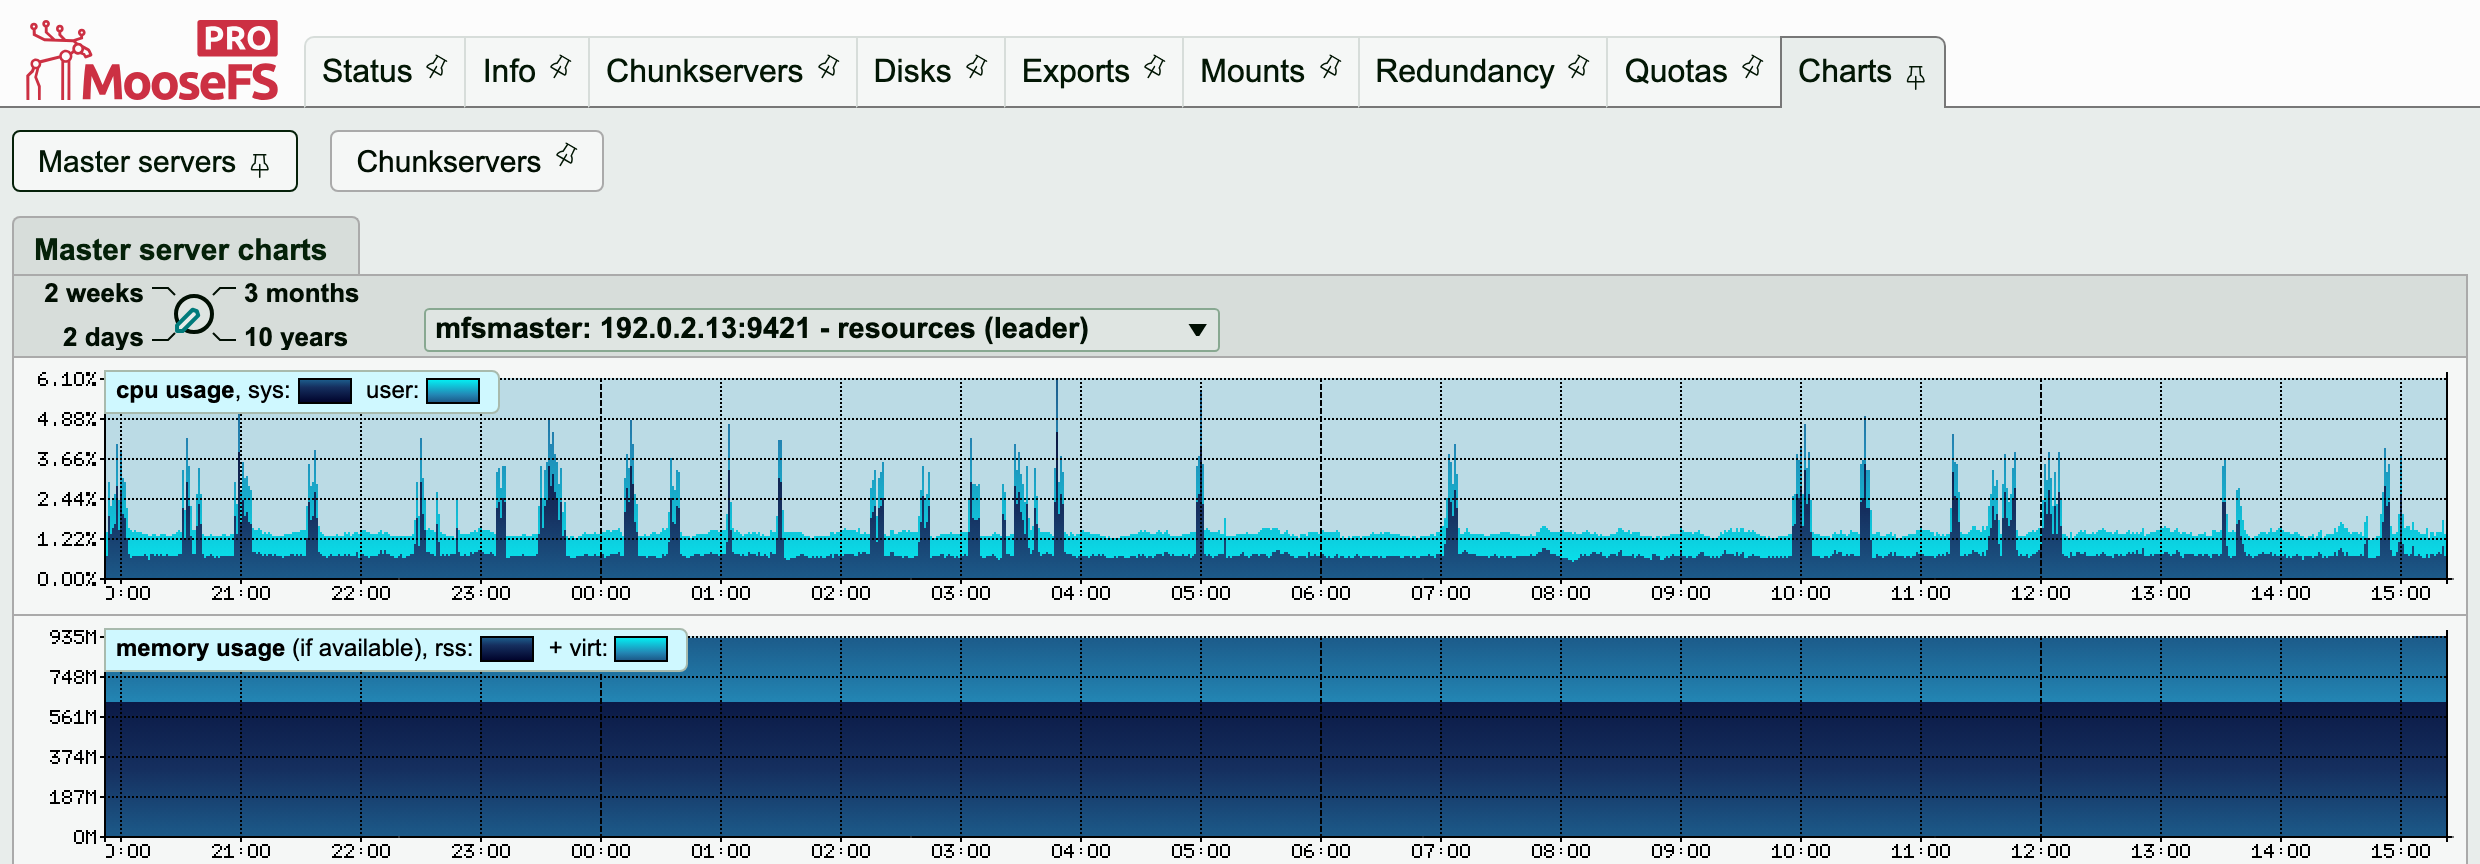
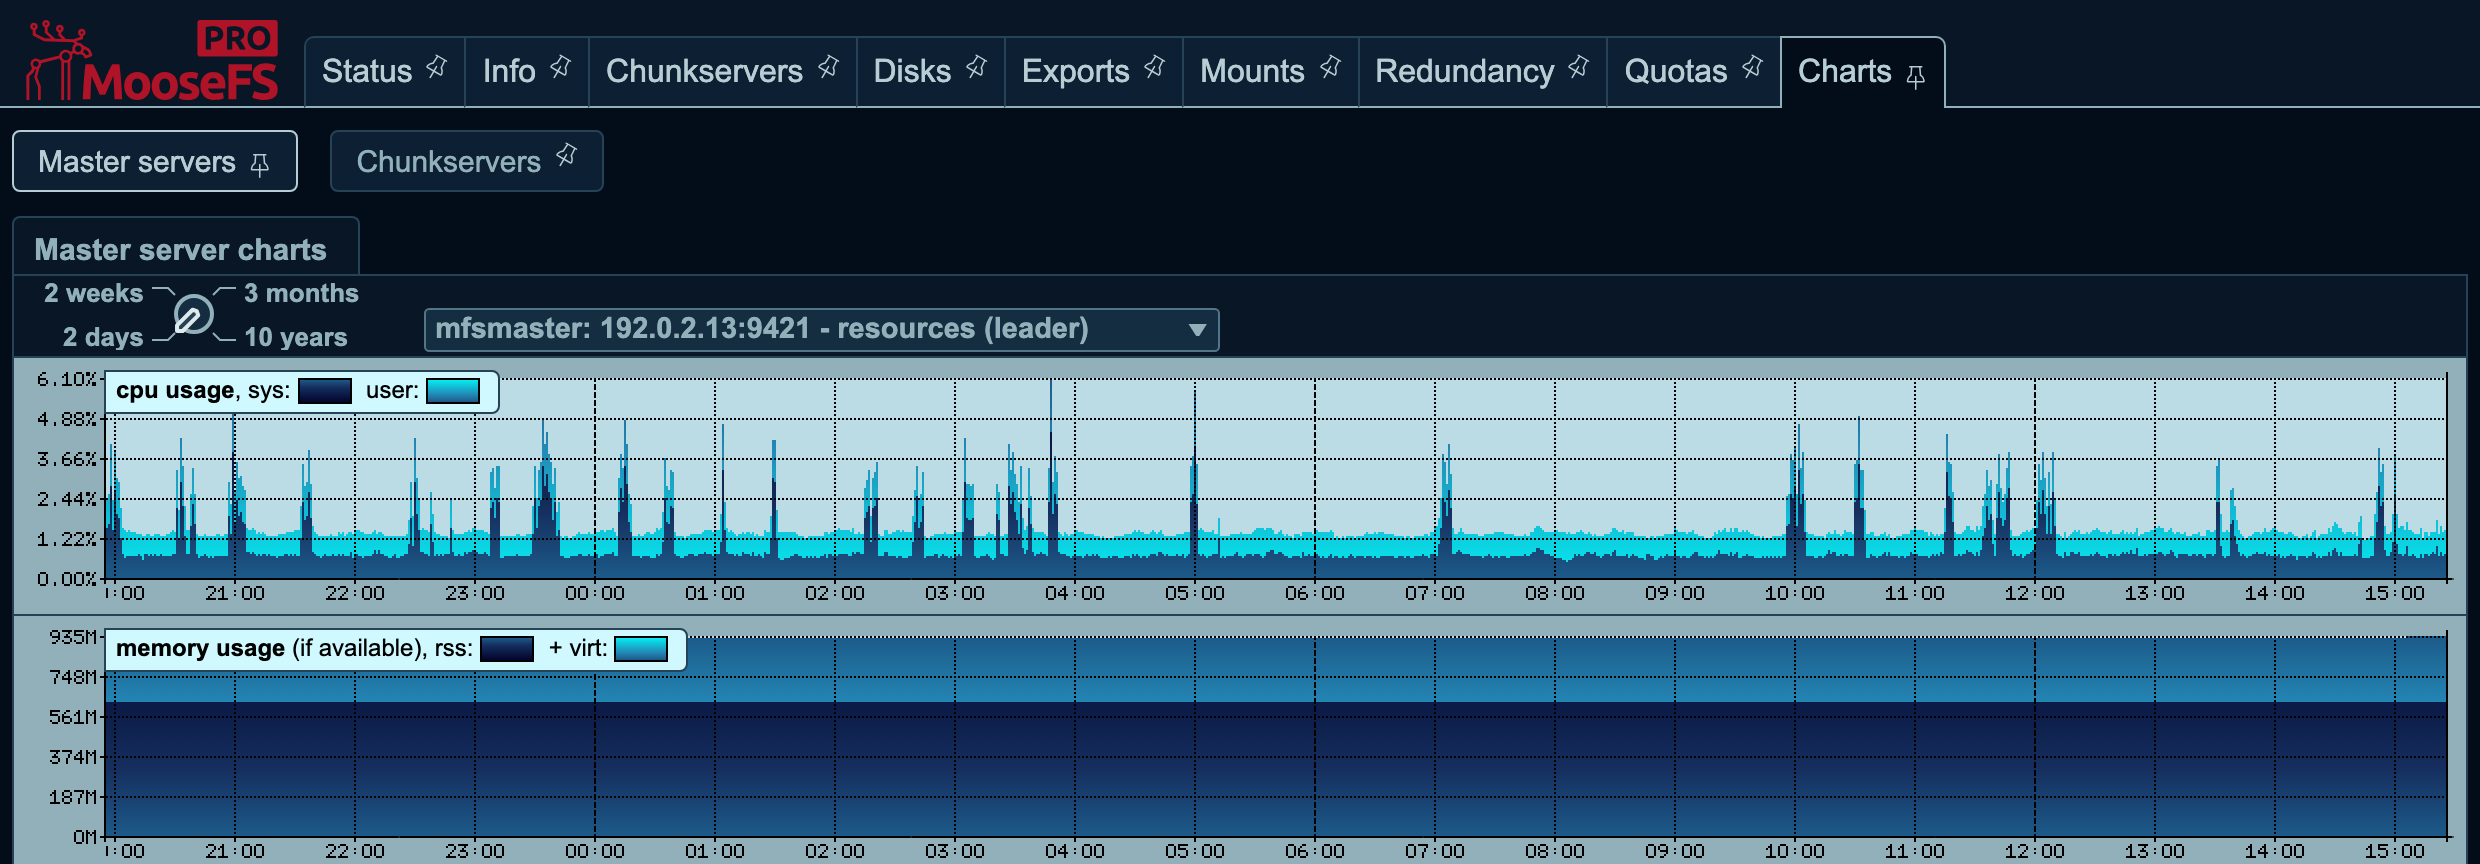
The resources sheet of one Master Server, the Leader here. The dial on the left picks which of the four ranges every chart under it is drawn in.
The Chunkservers subtab stays empty until you pick something from its selector. When you pick a server, the GUI draws every chart of that server.
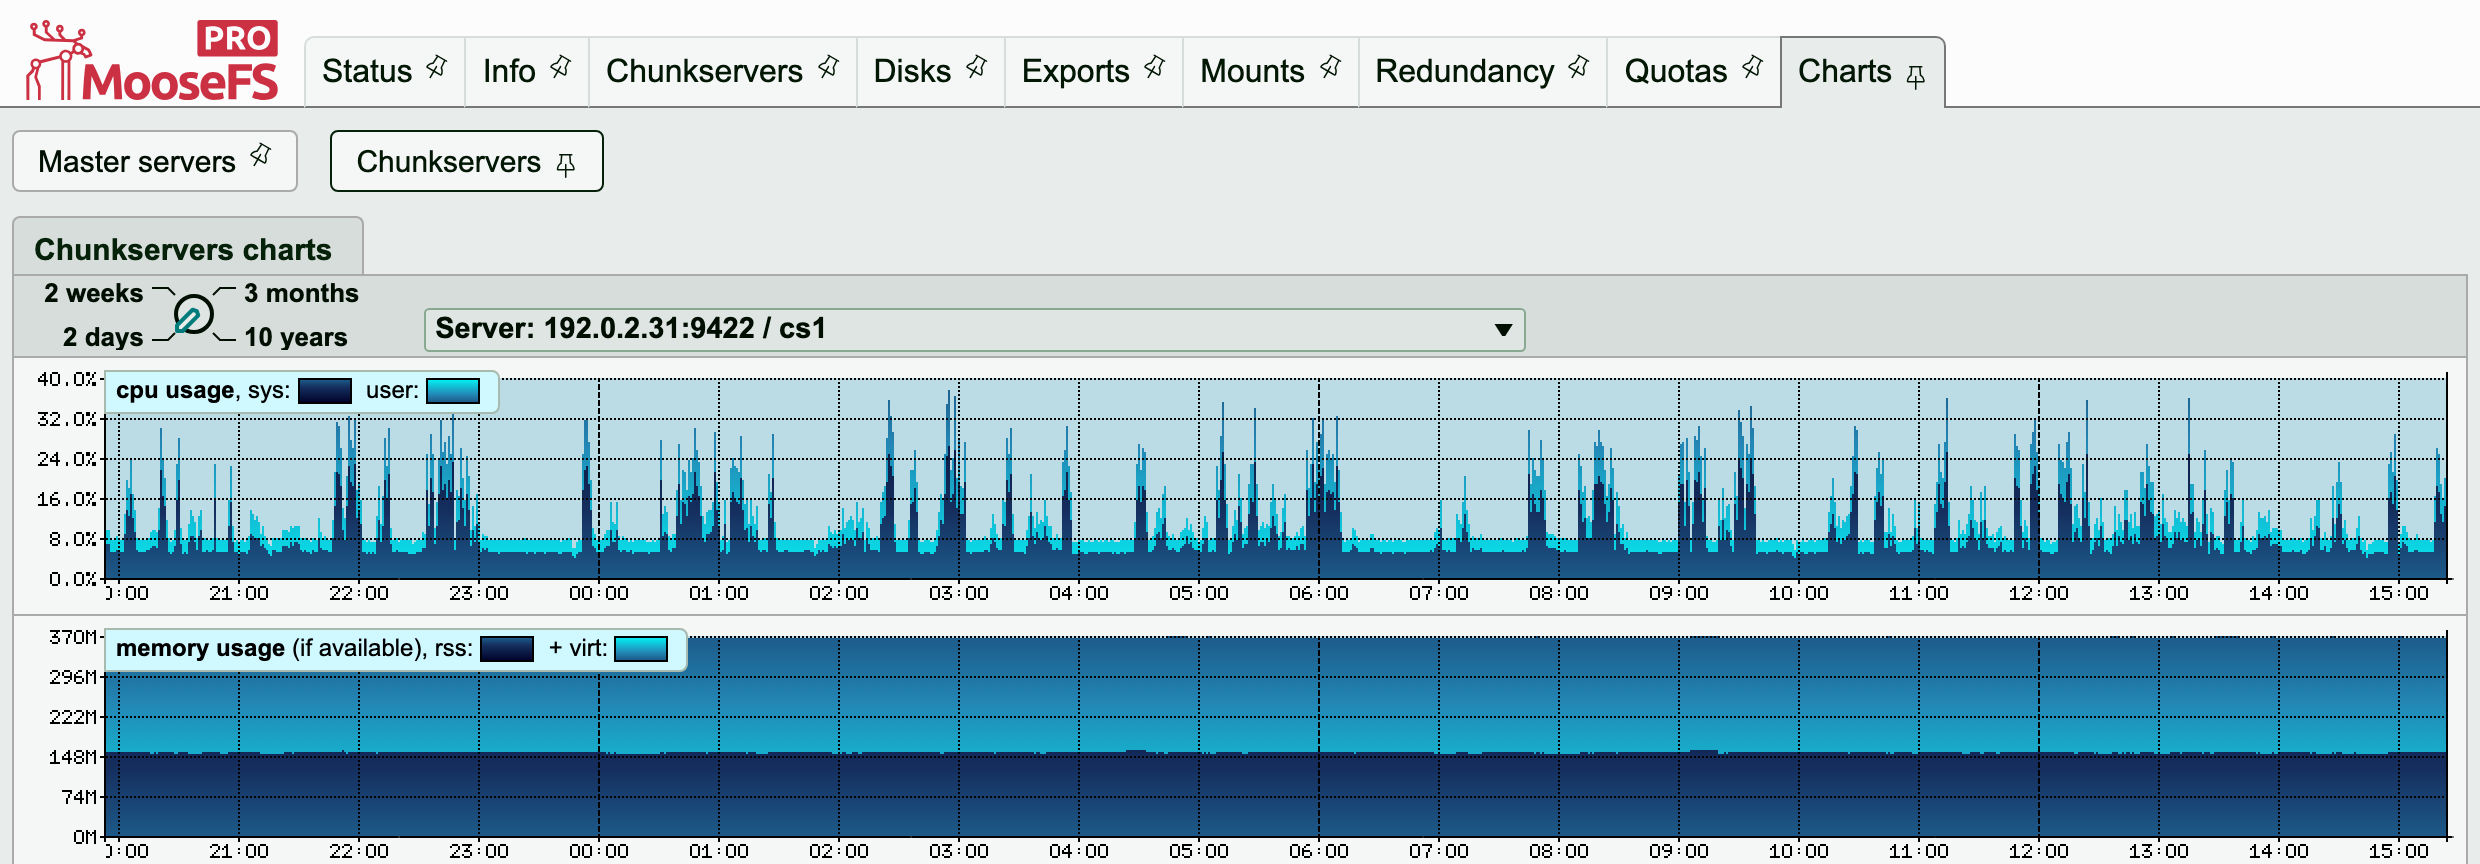
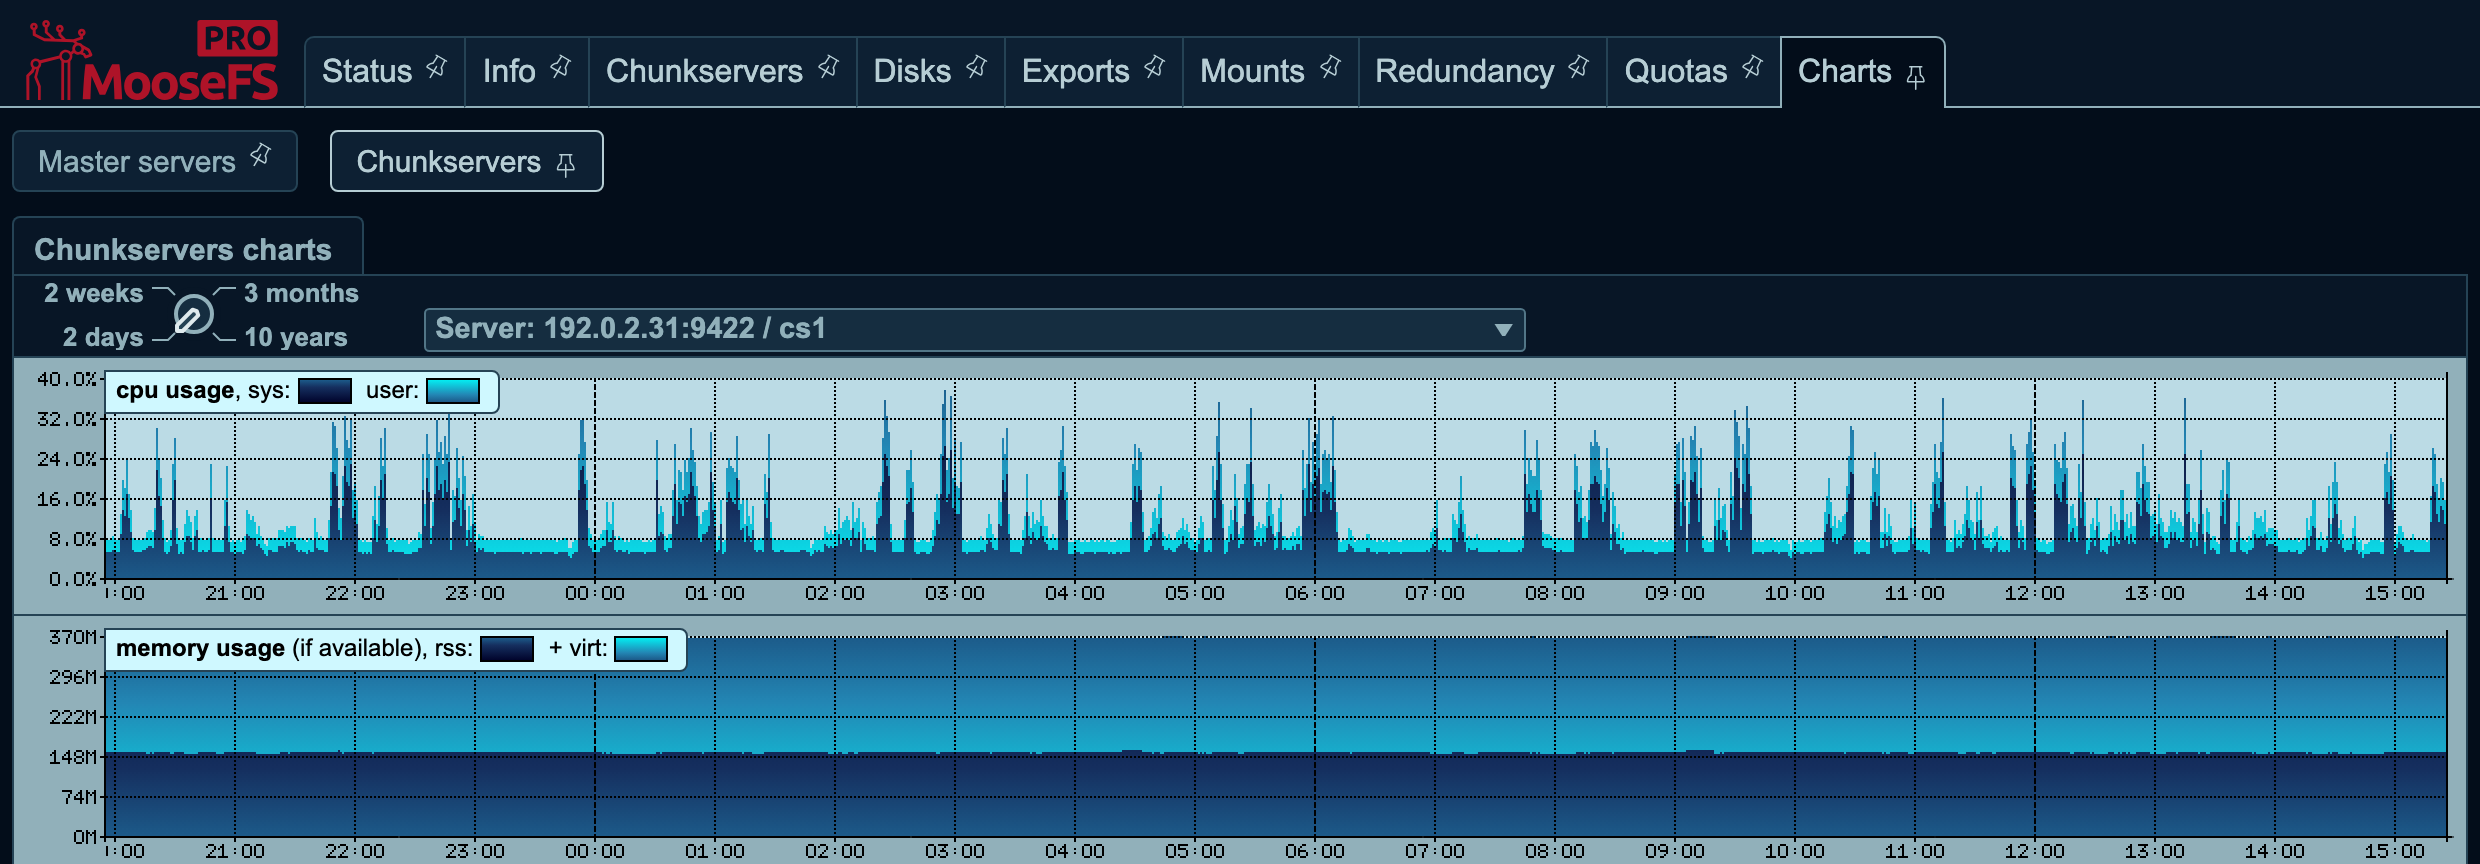
One Chunkserver picked by name, which draws the whole set of its charts one under another.
When you pick a data type, the GUI draws that chart for every server, one under another. The Use common Y-scale switch appears only in that mode. With the switch on, the GUI draws every chart in the set to the scale of the highest peak in the set. The same height then means the same value on every server. With the switch off, each chart is scaled to its own peak.
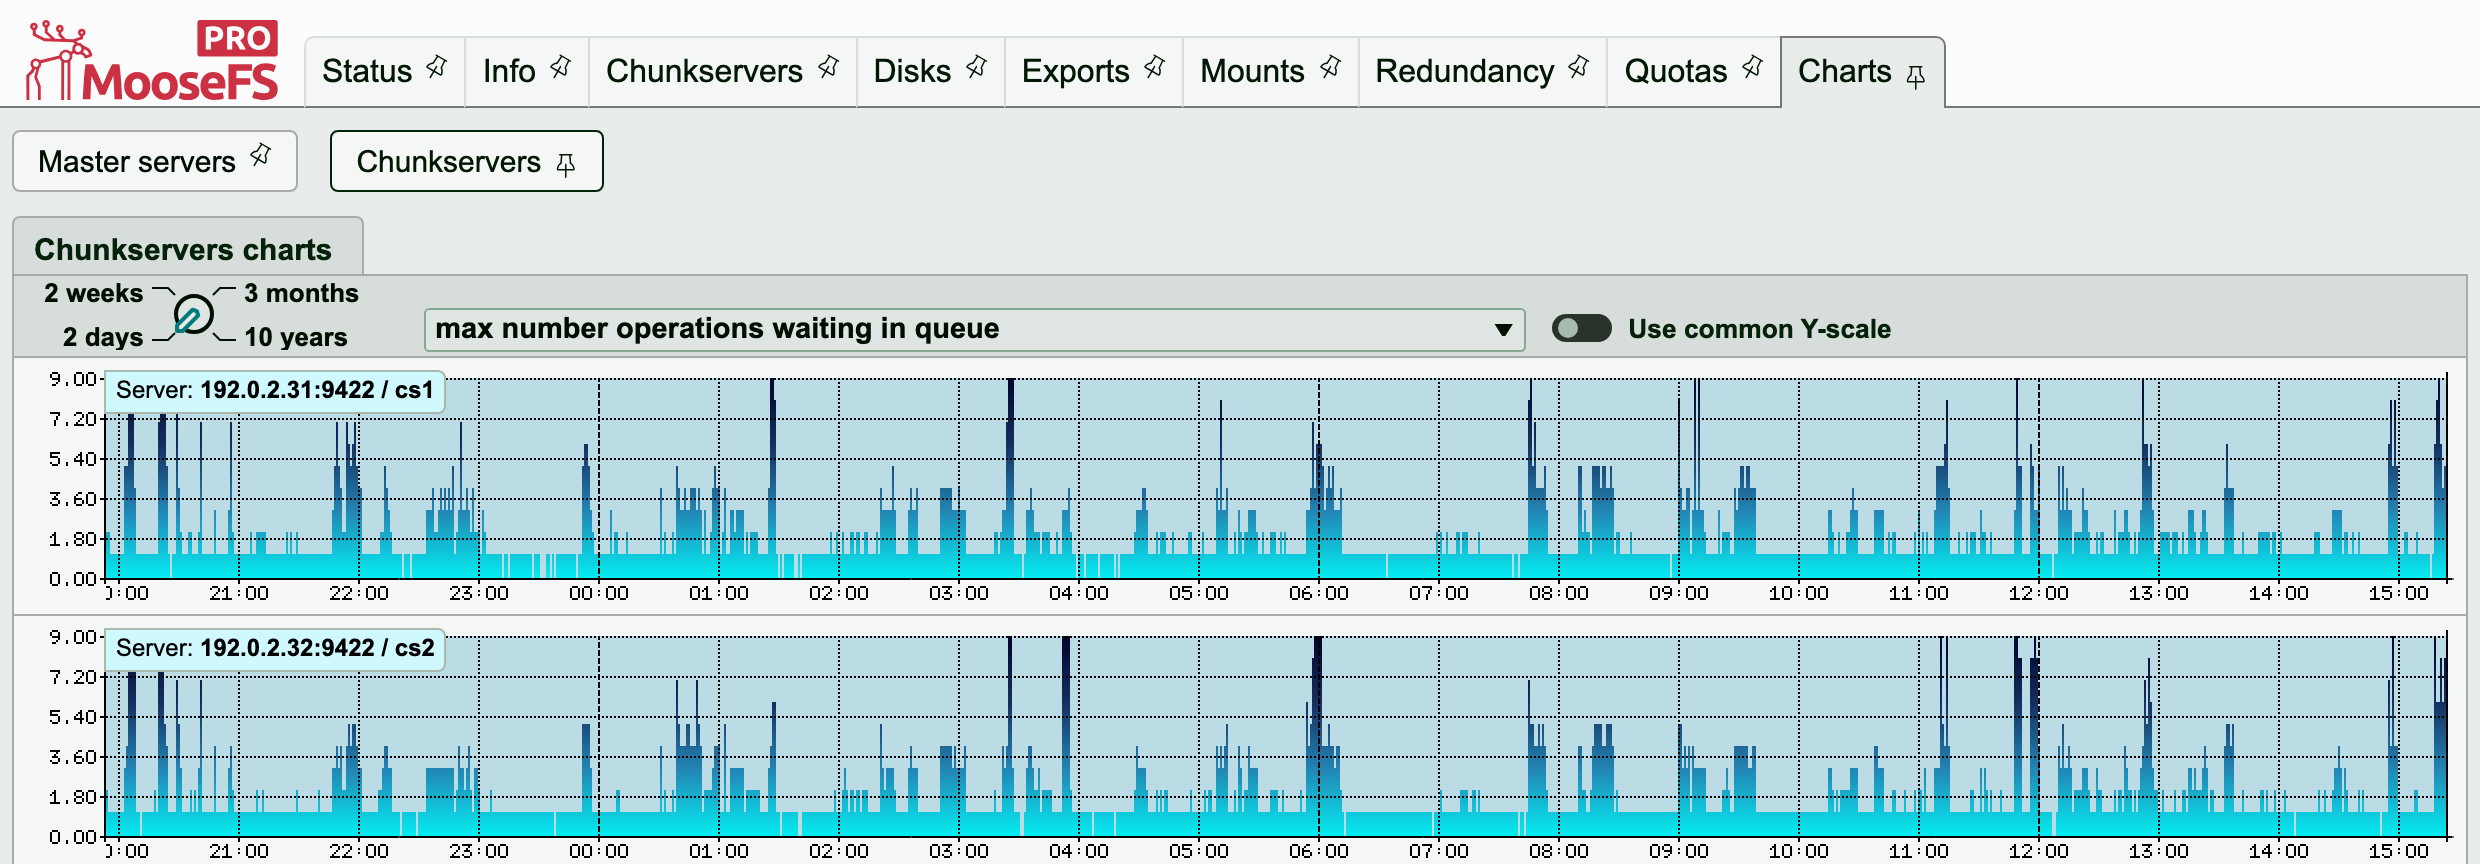
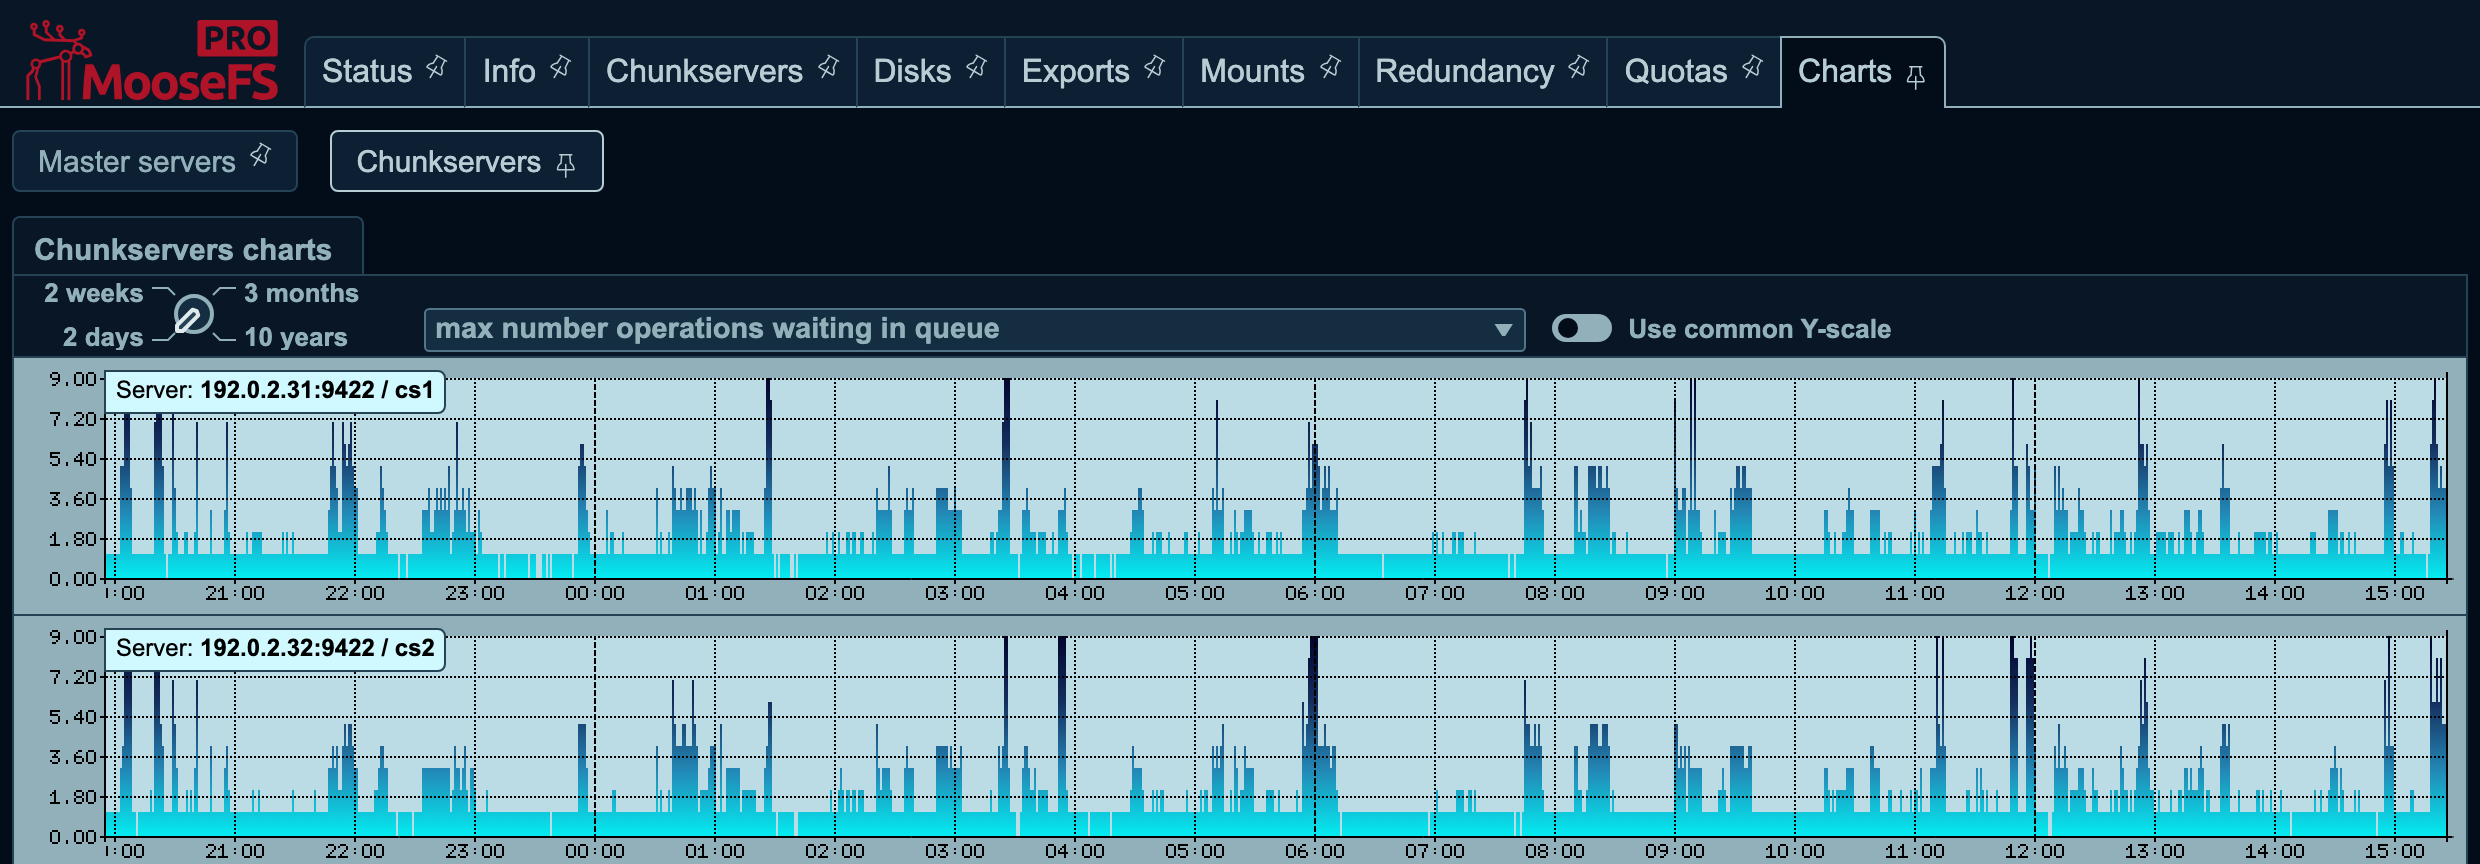
The same data type across the servers, one chart per server, each headed by the address and name of the server it belongs to. Use common Y-scale appears next to the selector and is off here, so each chart carries a scale of its own.
Below the main set are two comparison charts with their own range dial and selectors. The second selector is labeled versus:. The comparison charts belong to one server, so on the Chunkservers subtab they appear only when a server is picked. In the data type mode, the GUI does not show them. One dial controls a whole group of charts and changes the range of all of them together. The browser already has all four ranges. Switching the range therefore redraws the charts from the data in the browser, without a new request to the server.
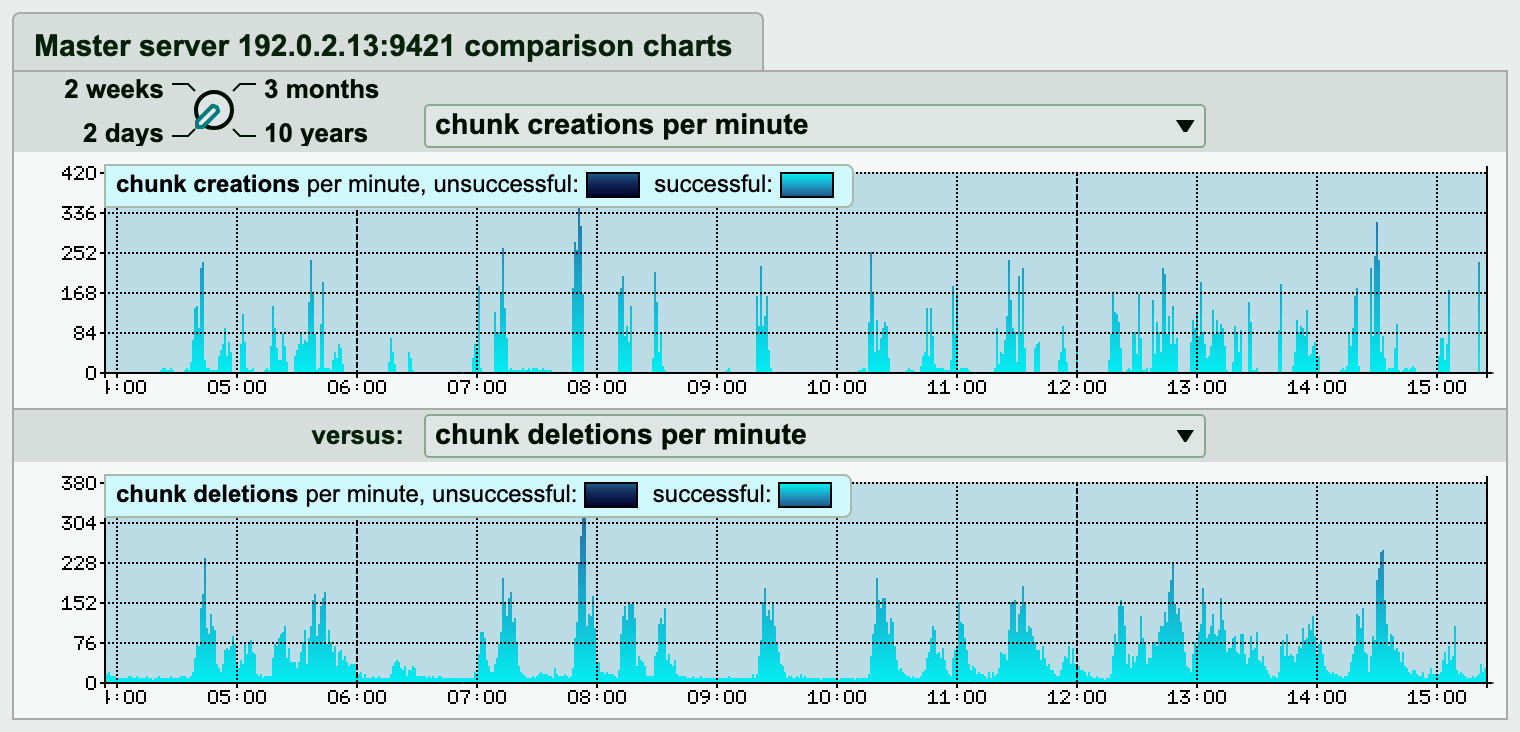
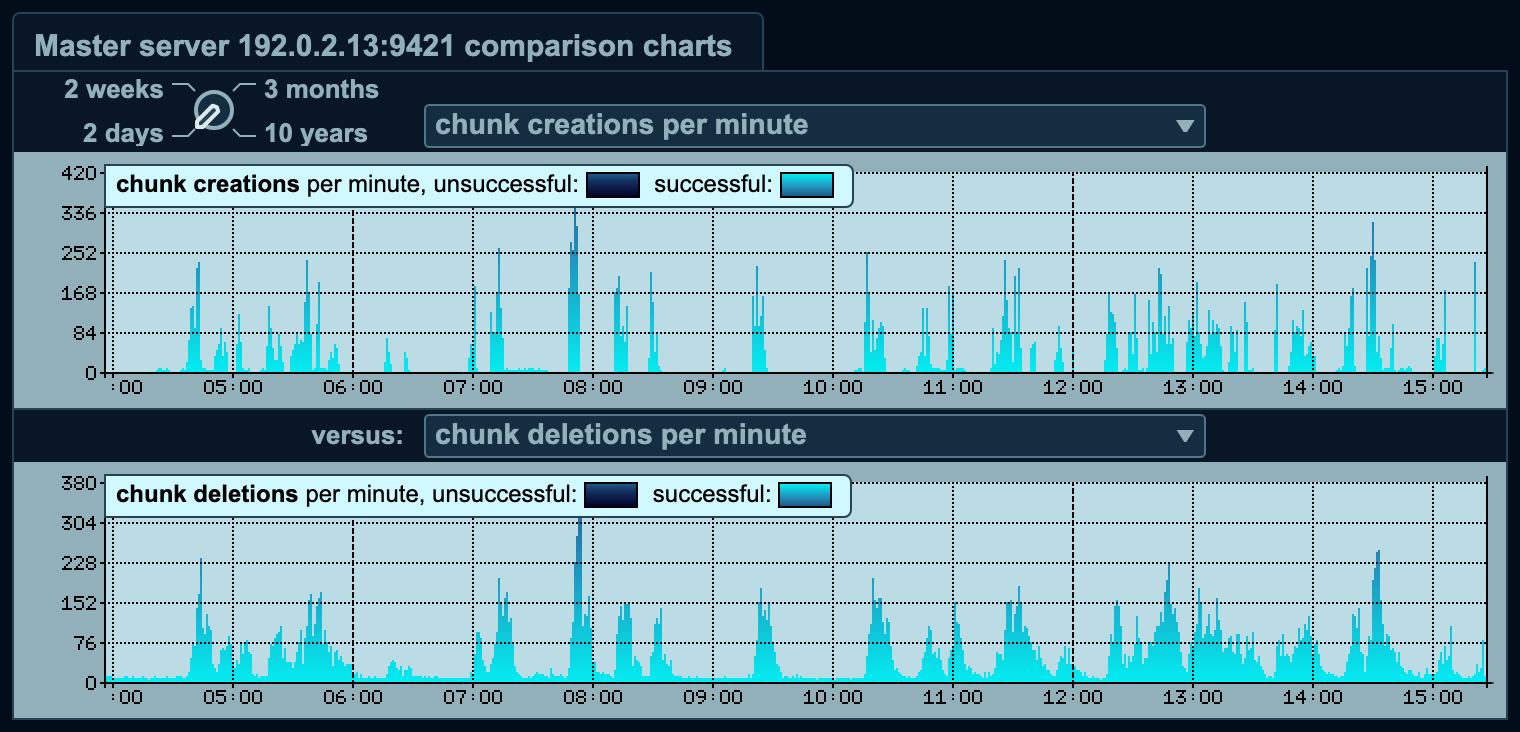
The comparison block puts two series of the same server one above the other in the same range, here the chunk creations against the deletions. Its dial and its two selectors are separate from the dial and selectors above it.
Which chart answers which question
On screen, a chart has a caption. In the dump tools and in the CLI, the chart has the names of the series that it is drawn from, one name per shade.
Load on the machine
Both daemons have the same two charts. The CPU chart combines ucpu, the "CPU usage of the Master Server consumed by user processes", and scpu, the CPU usage consumed by system processes. On a Chunkserver, the same pair reports the CPU usage of the Chunkserver. 100 percent on the chart is one core occupied for the whole minute. The measurement covers the daemon and its threads but no child process. A Master Server writes the metadata dump in a child process, so the dump does not appear on this chart. A Chunkserver sums all of its threads into one figure, so a reading above 100 percent there is ordinary.
The memory chart combines memoryrss, the "Resident memory usage", with memoryvirt, the "Virtual memory usage". Both are in bytes, and both record the highest value in the minute.
Space, objects, and chunk state
usedspaceandtotalspaceare the "RAW disk space usage" and the "RAW disk space connected" in bytes, summed over the connected Chunkservers. Used space is the total minus the available space. TheRESERVE_SPACEmargin ofmfsmaster.cfgis already subtracted from the available space, so a reserve set above zero is drawn as used.fileobjectsis the "Number of file objects". The chart draws this series against the other metadata objects, under the captionnumber of meta objects (others/files).chunkscopy,chunksec4, andchunksec8are the "Total number of chunks stored in COPY format" and the same count for the two Erasure Coding formats, EC4 and EC8. These series count logical chunks, not the copies and parts stored on disks. A chunk left without a single valid copy is not in the sum.chregdangerandchregunderare the "Number of endangered chunks excluding those marked for removal" and the "Number of undergoal chunks excluding those marked for removal".challdangerandchallunderare the same two counts with the copies on disks marked for removal counted toward each chunk's redundancy. All four count chunks and not copies, so a chunk that those copies raise to a better grade leaves the pair that counts them, but a chunk whose grade they do not change stands in both pairs alike.udiffis the difference in fill between the fullest and the emptiest Chunkserver, as a percentage with three decimal places, under the captionspace usage difference.
Metadata operations on the Master Server
The operations sheet has one chart per call, all counted per minute. The charts cover statfs, getattr, setattr, lookup, mkdir, rmdir, symlink, readlink, mknod, unlink, rename, link, readdir, open, truncate, and the file create operations under the series name createobj. Further charts count the calls for snapshots, file locks, extended attributes, and access control lists. The names leave out these details:
read,write, andfsynccount the calls that the kernel passed to the mounts and that the mounts reported back. These series count calls, not bytes, and not disk work.setattrleaves out a change of file length.truncatecounts that change.all meta data operationscovers reads as well as changes. Storage Class, trash retention, extended attribute, and archive calls count both when they read a value and when they set one. Quota calls count too. A call that walks a whole subtree counts once.
The resources sheet adds one chart about metadata that is not a call count. On a Master Server that is not the Leader, delay PRO (PRO Edition only) reports in seconds how far this server is behind the Leader's changelog. The value is the highest value in the minute, with one second subtracted. On the Leader itself, the chart has no data.
Chunk work the Master Server orders
Every chunk operation is counted twice. The first count is an attempt, when the order is sent to a Chunkserver. The second count is an outcome, when the answer returns. The per-minute charts draw the outcome pair, successful and unsuccessful, for deletions, replications, creations, internal operations, and splits. The attempt counters are next to the outcome counters in the dumped data. Among the attempt counters are delete, the "Number of chunk deletion attempts", replicate, the "Number of chunk replication attempts", and change, the "Number of chunk internal operation attempts". How the counting works:
- Creations count every copy on its own, so one chunk stored in three copies counts three times.
- A replication counts one order per chunk part, whether that part is a copy or an Erasure Coding fragment.
- The attempt counter
changeincludes split attempts, butchange_okandchange_errleave them out. Splits have their own outcome pair,split_okandsplit_err, and their own chart.
Traffic
prcvdandpsentare the "Packets received by Master Server" and the "Packets sent by Master Server", per second. Both count only what passes between the Master Server and the mounts. Packets from Chunkservers and from other Master Servers are not included.brcvdandbsentcount the bytes in those packets. The chart draws these bytes as bits per second.- Four Master Server series count the data of the mounts. These series answer two different questions.
bytesreadandbyteswriteare the bytes thatread()returned to applications and that applications passed towrite().mountbytrcvdandmountbytsentare the chunk data that crossed the network between the mounts and the Chunkservers, so they include read-ahead and Erasure Coding parts. The two pairs therefore do not have to agree. All four series are on the resources sheet, under captions that begintraffic from clusterandtraffic to cluster. - On a Chunkserver,
masterinandmasteroutare the traffic with the Master Server in bits per second.bwinandbwoutare the traffic with clients and with other Chunkservers, also in bits per second. The chart draws them as two shades: the part served by the main server and the part moved by the replicator. On the source server, data that the replicator reads cannot be told apart from a client read. That data is counted in the main server part. hddreadandhddwriteare the bytes per second that reached the disks, split into chunk data and into chunk headers with their checksums. The captions arebytes read - data/other (bytes/s)andbytes written - data/other (bytes/s).
Disk work on the Chunkserver
rtimeandwtimeare the summed time that the data operations took, under the captionstime of data read operationsandtime of data write operations. In the dumped data, the value is a ratio: seconds of disk work per second of clock time. A value of 1.0 therefore means that one operation was running for the whole minute. On a server with several disks, the value goes above 1.0.wtimeincludes the time spent infsync. An operation whose measured time was zero or less is not counted at all.loadis the number of busy worker threads plus the jobs waiting in the queue, summed over both job pools. The value is the highest value in the minute. The maximum is the size of the worker pools, set inmfschunkserver.cfg.hddok,hddmfr, andhdddmgcount the disks in service, the disks marked for removal, and the disks that are damaged or are being removed. The caption isnumber of folders (hard drives) with data.udiffon a Chunkserver is the difference in fill between the disks of that one server. Only the scanned disks that are healthy and not marked for removal are counted.copychunks,ec4chunks, andec8chunkscount the copies and parts that this server holds, including the disks marked for removal.replcounts the replications in which this server is the target.createanddeletecount what the Master Server ordered. These counters leave out what the replicator does on its own, and the replication chart shows that work instead.changesums version changes, duplicates, truncates, duplicate truncates, and splits.movelsandmovehscount the chunks moved between the disks of this same server by the slow and the fast rebalance.
High level and low level count different work
Two pairs of Chunkserver charts look alike and count different things.
The low level pair is drawn under the captions number of low-level read operations (per minute) and number of low-level write operations (per minute). This pair counts the read and write operations that the disk manager issued to the operating system, split into two shades: chunk data and chunk headers. One data read covers at most one 64 KiB block, so a large request turns into many data reads.
The high level pair, hlopr and hlopw, is drawn under the captions number of high-level read operations (per minute) and number of high-level write operations (per minute). This pair counts the external protocol requests that the Chunkserver completed. A high ratio of low level to high level means that one external request turns into many disk operations. Read that ratio together with rtime, wtime, and load.
Two kinds of work that did not come from a client are counted in the high level counters. A replication reads from its source with the same request that a client uses. Replication therefore counts as a high level read on the source server. A write goes along a chain of Chunkservers. Each server passes the request to the next server, so one write into a file stored in three copies counts on all three.
Reading the same series outside the interface
mfsstatsdump and mfscsstatsdump read the stored file and print the series as CSV, or draw them as PNG. These tools read the file, not the running daemon. They therefore show the cluster as of the last hourly write. The GUI shows the last completed minute. -r accepts the same resolution numbers as the dial, 0 to 3. The option changes the step, not the amount of output: the CSV always has 4096 rows. -f names the fields and is required. -f '*' selects all of them. The two tools have different field sets: 83 names for the Master Server and 60 for a Chunkserver.
mfsstatsdump -f cpu,usedspace,totalspace -r 2 -d
mfscsstatsdump -f hlopr,hlopw,rtime,wtime -r 0 -d
The bare timestamp in the first column is not Unix time. The daemon stamps its windows in local time, so the value carries the time zone offset of the server that produced it. Pass -d for a YYYY-MM-DD HH:MM date instead, and convert before joining these rows with data from another monitoring system.
With -p, the tools write one PNG per field instead of the CSV. The picture has one sample per pixel of its plot area. The default width of 1600 px therefore draws the last 1550 samples of the range. A full range needs -x 4146. Width is limited to between 150 px and 4146 px. Height is limited to between 120 px and 1020 px and rounded down to a multiple of 20 px.
mfscli prints the same data as text. The tool requests the data from the running daemon, so its output also reaches the last completed minute. -SMC and -SCC select the Master Server and the Chunkserver charts. -m accepts the same resolution numbers 0 to 3. -a and -c set how many entries to print, up to 4095. -b and -d choose the columns, under the CLI's own series names. Those names do not always match the names above. The network and disk charts of a Chunkserver use names such as csservin, csrepin, databytesr, and hdrbytesr. The change series is missing from the CLI list altogether. Passing all to -b or -d selects only the single series. Request a chart built from several series by name, as in -b cpu.
For a history that reaches further back than these four ranges, and for charts of your own design, use a time series database outside the cluster. Prometheus metrics covers what the cluster exposes for scraping. Grafana covers the dashboards built on those metrics.