The GUI
The GUI is a web interface to one MooseFS cluster. The GUI keeps no state of its own. The numbers are read live from the servers themselves, most of them from the Master Server over the same client port that a mount uses. The GUI lays them out as a row of tabs. Nearly all of the GUI is read-only. The links that act on the cluster are the maintenance switch on a Chunkserver, the removal of a disconnected Chunkserver, and the dismissal of a disk error. The remaining two links end an inactive mount session and send a Chunkserver back to work from its grace period. Adding readonly=1 to the address hides those links. Use this parameter for a screen that nobody should click. The parameter is a display choice rather than a restriction, because it can be left out again.
The GUI server does not have to run on the Master Server. Nothing requires the GUI server to run there, because the address that the GUI server queries comes from the request that the browser sends. When the request has no address, the GUI server falls back to the master name that the packages were built with, mfsmaster. Running the GUI server on a host of its own is a tested arrangement. The GUI server needs a route to every server it reports on, because the Master Server relays none of these readings. The GUI server queries every address that the master name resolves to, not only the Leader. Each Master Server therefore has to be reachable on its client port. Disk figures and the charts of a single Chunkserver are read from that Chunkserver directly, so every Chunkserver has to be reachable on its own port too. The disks of a Chunkserver that the GUI server cannot reach read unknown (unreachable chunkserver). Both ports are in network ports. Access control covers where the GUI listens and how to put authentication in front of a server that has none of its own. The rest of the GUI's settings are in mfsgui.cfg.
The footer shows the instance name, the time of the last refresh, a switch between automatic and manual refresh, and the GUI version. The GUI version is marked when it differs from the version of the cluster that the GUI is pointed at. Automatic refresh redraws the page every 60 seconds.
When the cluster reports something about a value, the GUI marks that value in place with an icon. The severity of the icon is the cluster's own, and its tooltip gives the explanation and the suggested fix. The chunk matrix table also has such a mark next to its title. That mark sums up the state of the whole matrix. A second switch in the footer turns the on-screen tooltips off for a screen used as a wall display.
A missing tab tells you what the GUI can reach
The menu depends on what the GUI can reach. With a Leader Master Server the menu is complete. During an election, Mounts and Redundancy are missing, because the sections that they show exist only on a Leader. When the only Master Server that answers is a Follower or a Usurper PRO (PRO Edition only), only Info and the Master servers charts remain. When none answers, Info alone remains. When a tab that you expected is missing, read that first as a state of the cluster.
Two habits put more on the screen at once. Clicking a tab name shows that tab alone. The pin next to the name adds the tab to what is already on screen instead of replacing it, so several tabs can appear on one page. Selecting Info without choosing a subtab shows all of its subtabs at once. Redundancy opens on Storage Classes.
A cluster with more than one location PRO (PRO Edition only) gets a Location selector in the header. The selector lists All and every location name. The choice filters the other views. A view narrowed by the selector shows a funnel icon.
Each tab answers one question
| Tab | What you go there for | Where the answer is |
|---|---|---|
Status | Whether the cluster is healthy right now | Cards over a drawing of the servers: Total space, Health, Usage, and Performance. Health reads Normal, or the share of chunks that are missing or in danger, plus the number of servers behaving abnormally |
Info | Cluster-wide numbers | Subtabs Cluster Summary, Metadata Servers (Masters), Locations PRO (PRO Edition only), Licence Info PRO (PRO Edition only), Chunk Matrix Table, Filesystem Self-check Loop, Chunks Housekeeping Loop, and Memory Usage |
Chunkservers | Which server is absent, busy, or being emptied | Queue and Queue state, Maintenance reading OFF, ON, or TMP, 'Regular' hdd space and 'Marked for removal' hdd space with its status column. Servers that are gone stand in a second table, with the links that remove them. A Label: list above the table narrows it to the servers carrying one label |
Disks | Which disk is slow, failing, or leaving | last error, status, chunks, capacity, and I/O statistics per disk. The Filter: list narrows to disks with errors, to disks whose status is not ok, or to one server. Three knobs switch between address and server name, between the last minute, hour, and day, and between maximum and average operation time |
Exports | What a client will be allowed to do before it mounts | One row per export entry, with its address range, path, and every restriction that entry carries |
Mounts | What the connected clients are doing | Subtabs Parameters, Operations, and Open files and locks. Operations counts one column per file system call, over the knob Last hour or Current hour |
Redundancy | Whether the Storage Classes are being met | Subtab Storage Classes lists every class with its states, the Redundancy and Storage definition of each state, and an achievable column. With the knob at Show counters the subtab also lists the chunk counts behind them: deficient, stable, and over goal, each split between copies and Erasure Coding. Override Patterns lists the patterns that override a class |
Quotas | Which directories are close to their limits | Soft and hard limits next to current values, each value also as a percentage of both limits |
Charts | What the numbers above have been doing | Subtabs Master servers and Chunkservers, each with a range knob for 2 days, 2 weeks, 3 months, or 10 years. Reading them is in charts and statistics |
The Status drawing names what is wrong
The drawing groups the cluster by role: Master servers, Metaloggers where any are connected, and Chunkservers. Each Chunkserver on the drawing shows its name, its version, an indicator for its disks, and its queue state under Queue:. A version that differs from the Leader's is marked there. A server in maintenance mode says MAINTENANCE, one that has stopped answering says UNREACHABLE, and one whose location PRO (PRO Edition only) has been switched off says OFF (UNREACHABLE). Clicking a server opens the Chunkservers and Disks tables for that one server underneath the drawing. Clicking a card or a Master Server opens the table for that card or Master Server in the same place.
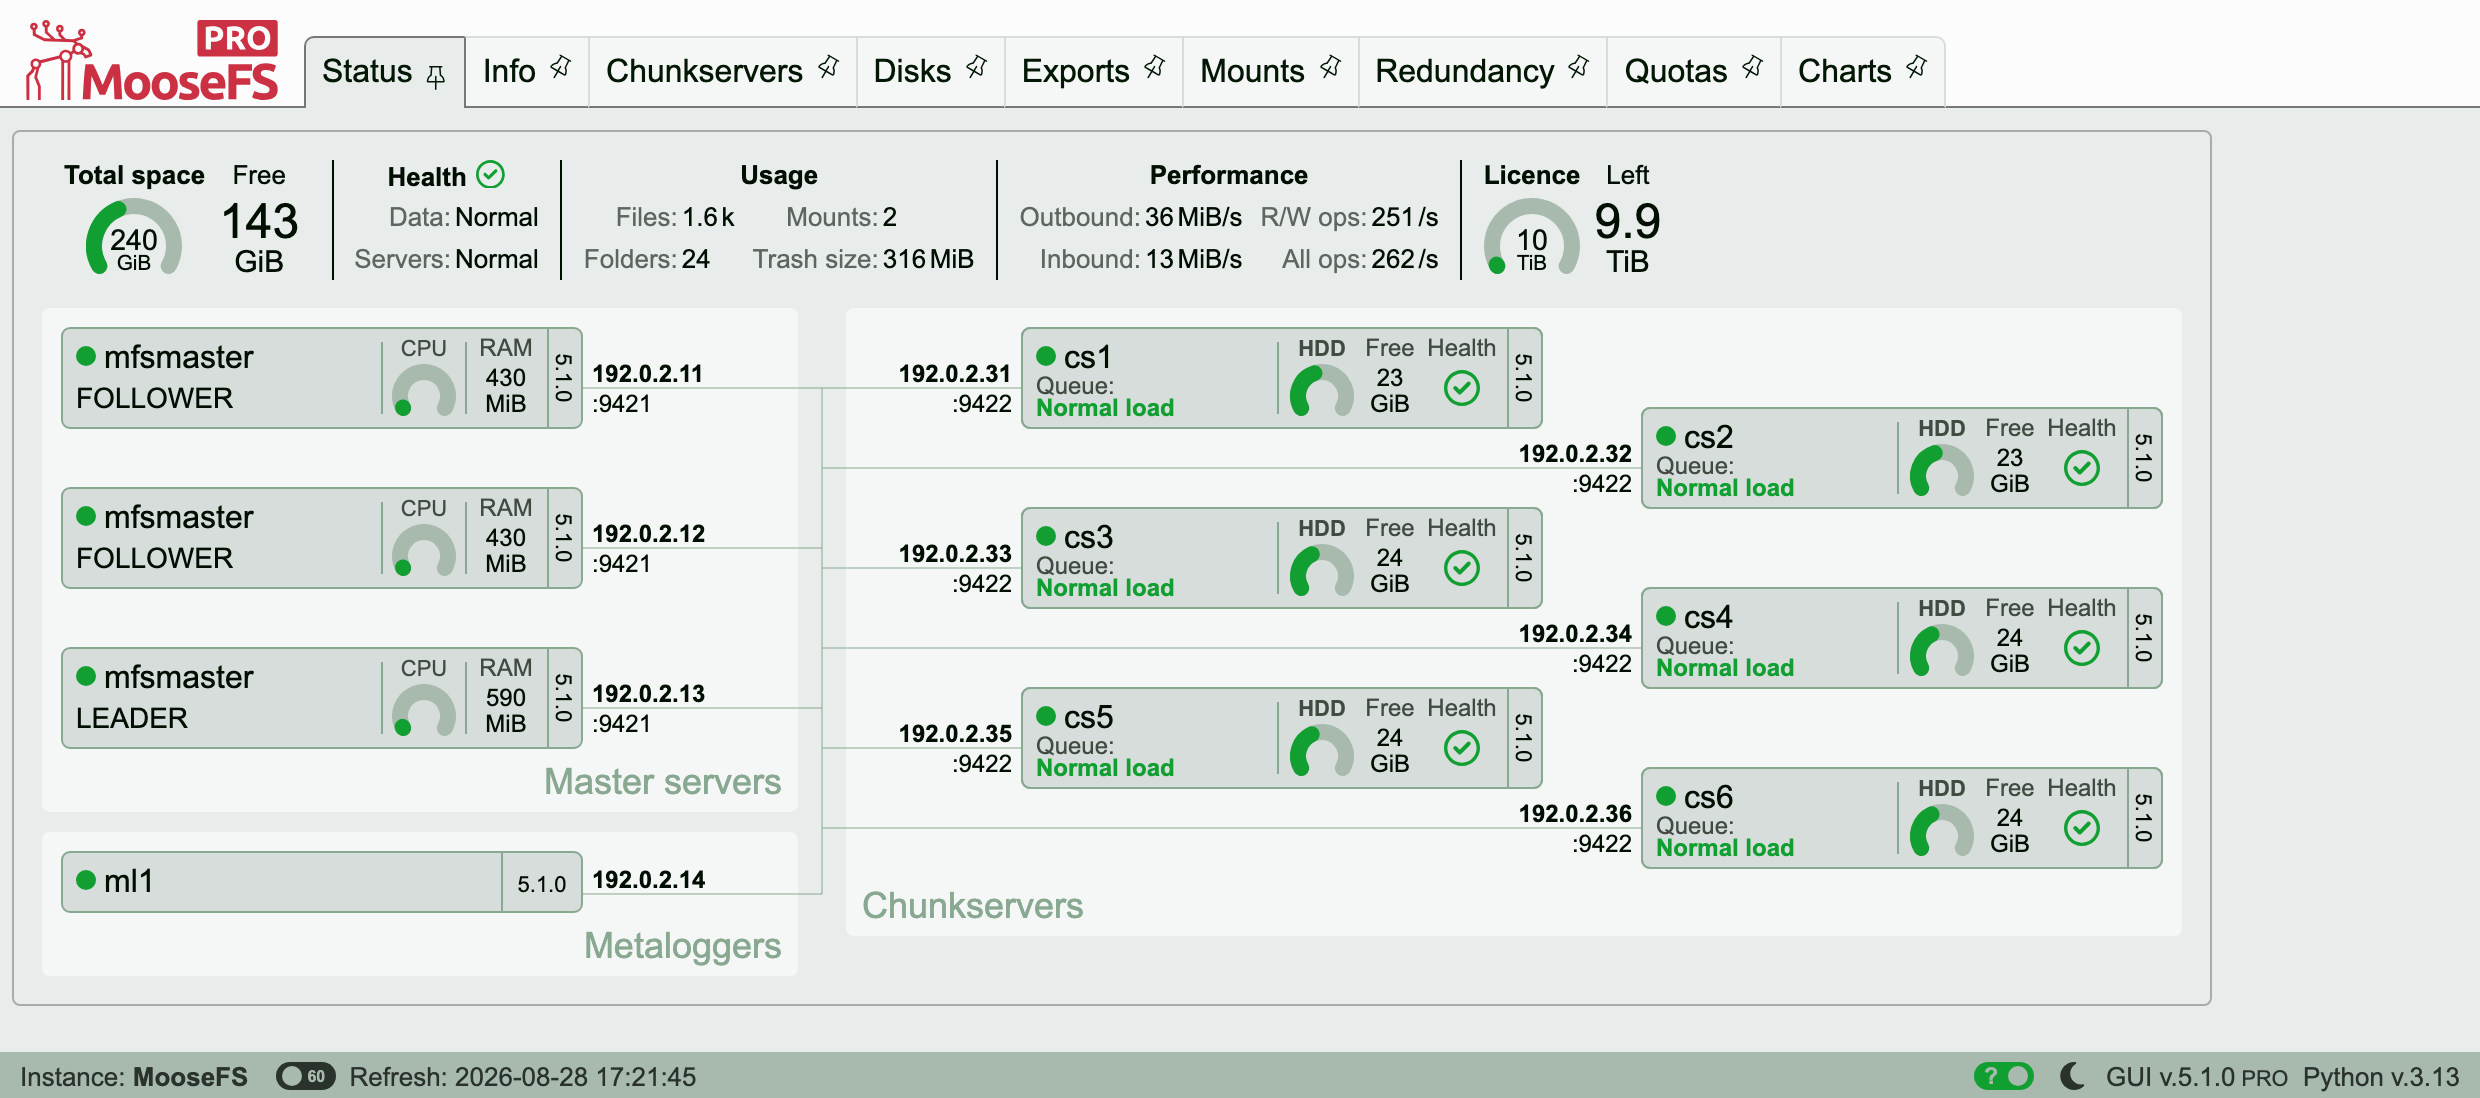
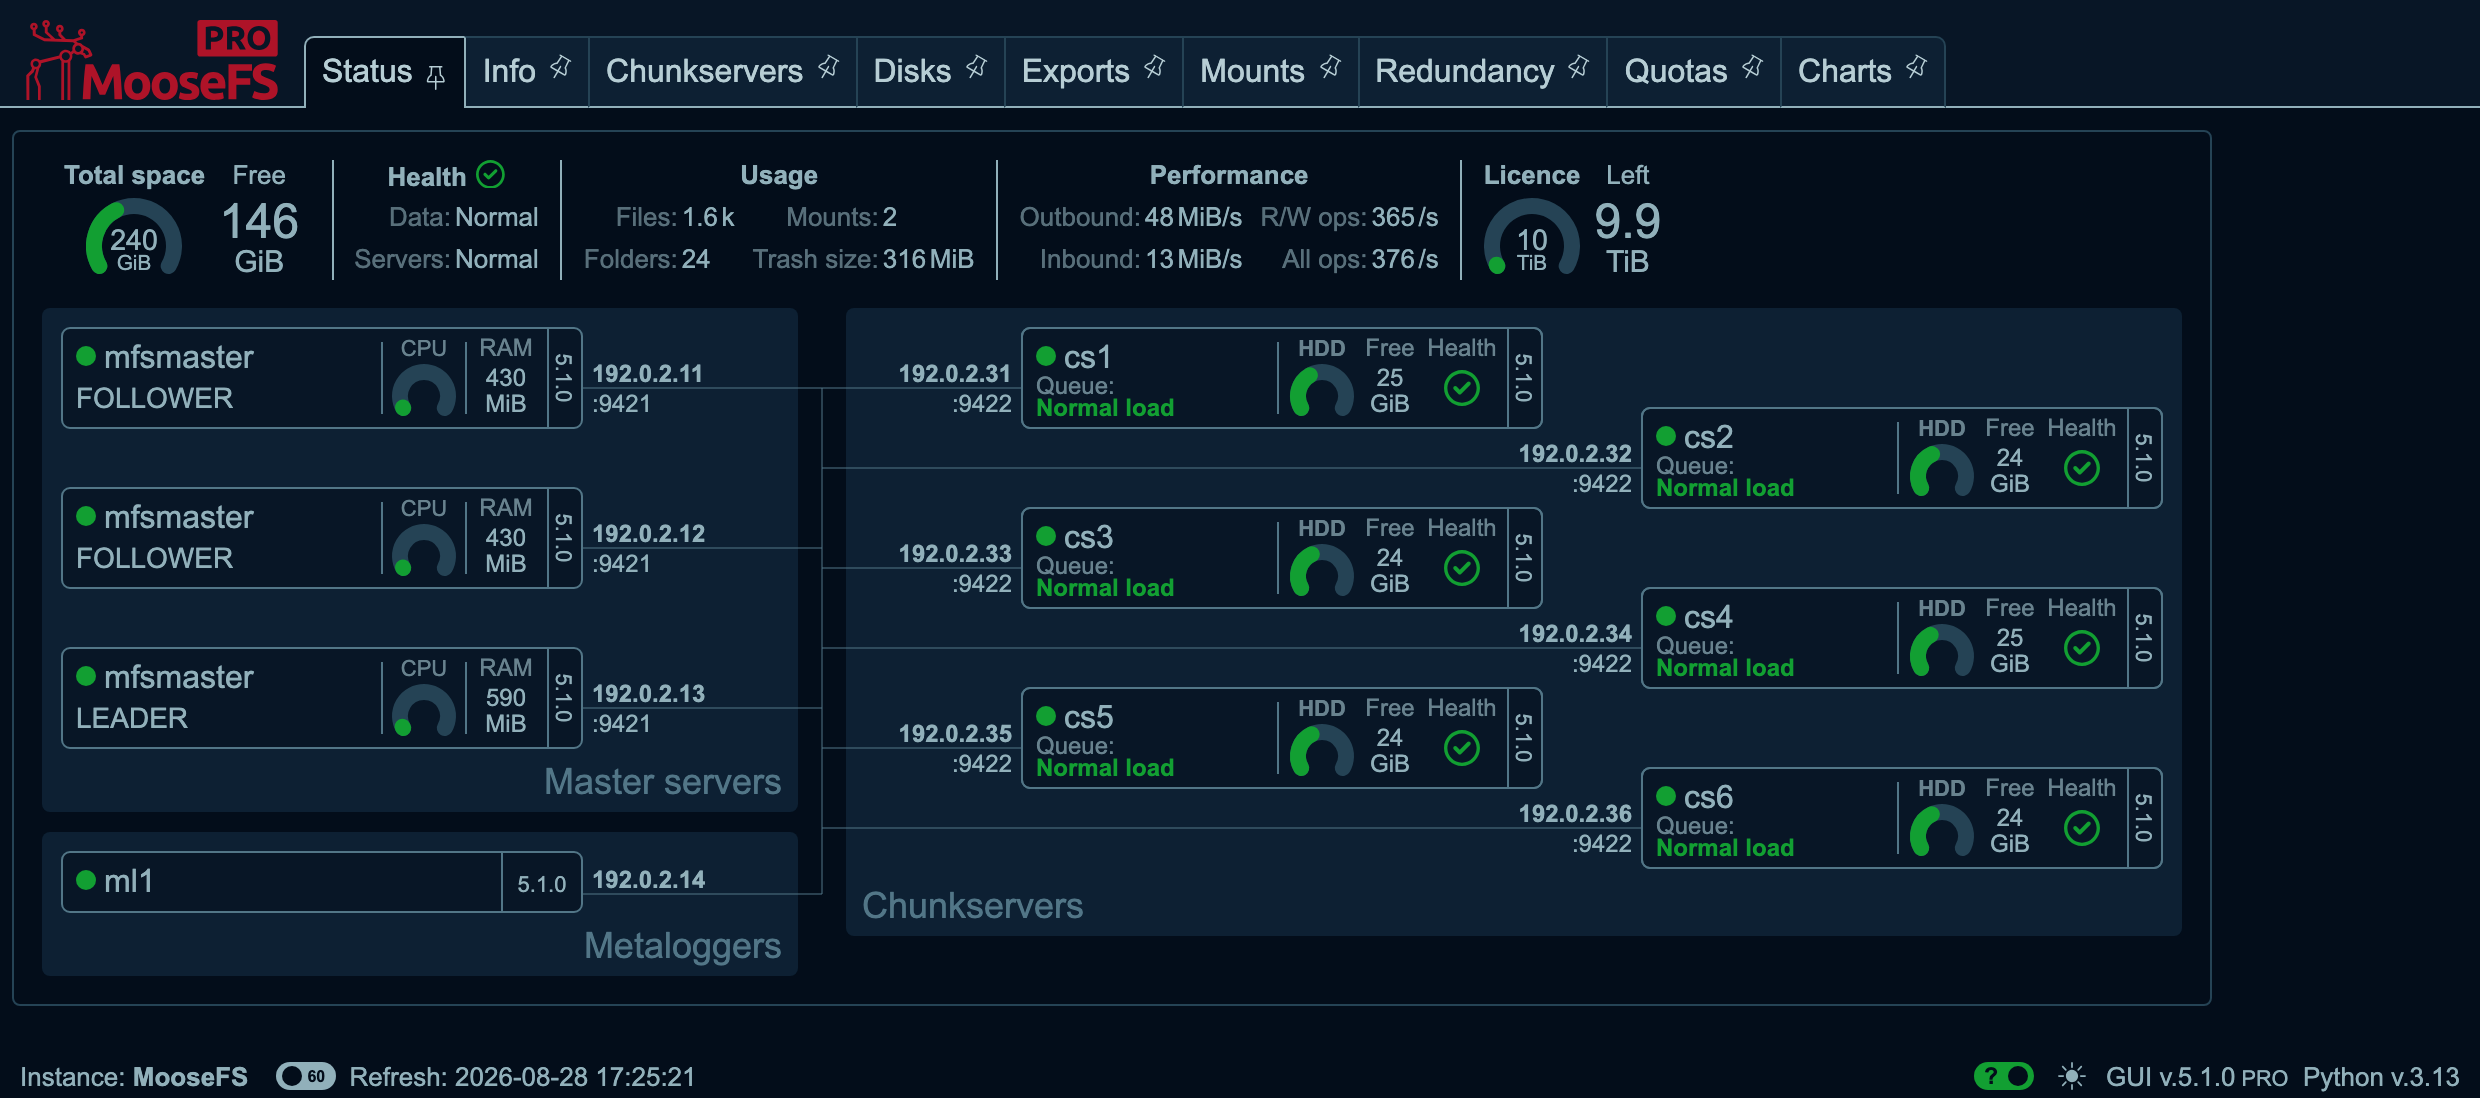
The Status tab of a healthy cluster: three Master Servers, one Metalogger and six Chunkservers. Each tile shows its name, version, disk indicator and queue state. The footer names the instance, the last refresh and the GUI version.
The chunk matrix reads expected redundancy against actual
Chunk Matrix Table on the Info tab contains the table titled Chunk matrix table. Its rows are the redundancy each chunk should have, and its columns the redundancy it does have. Chunk versions and states explains what the grades mean and why the matrix is the shape it is. The rest of this section covers how to read the screen.
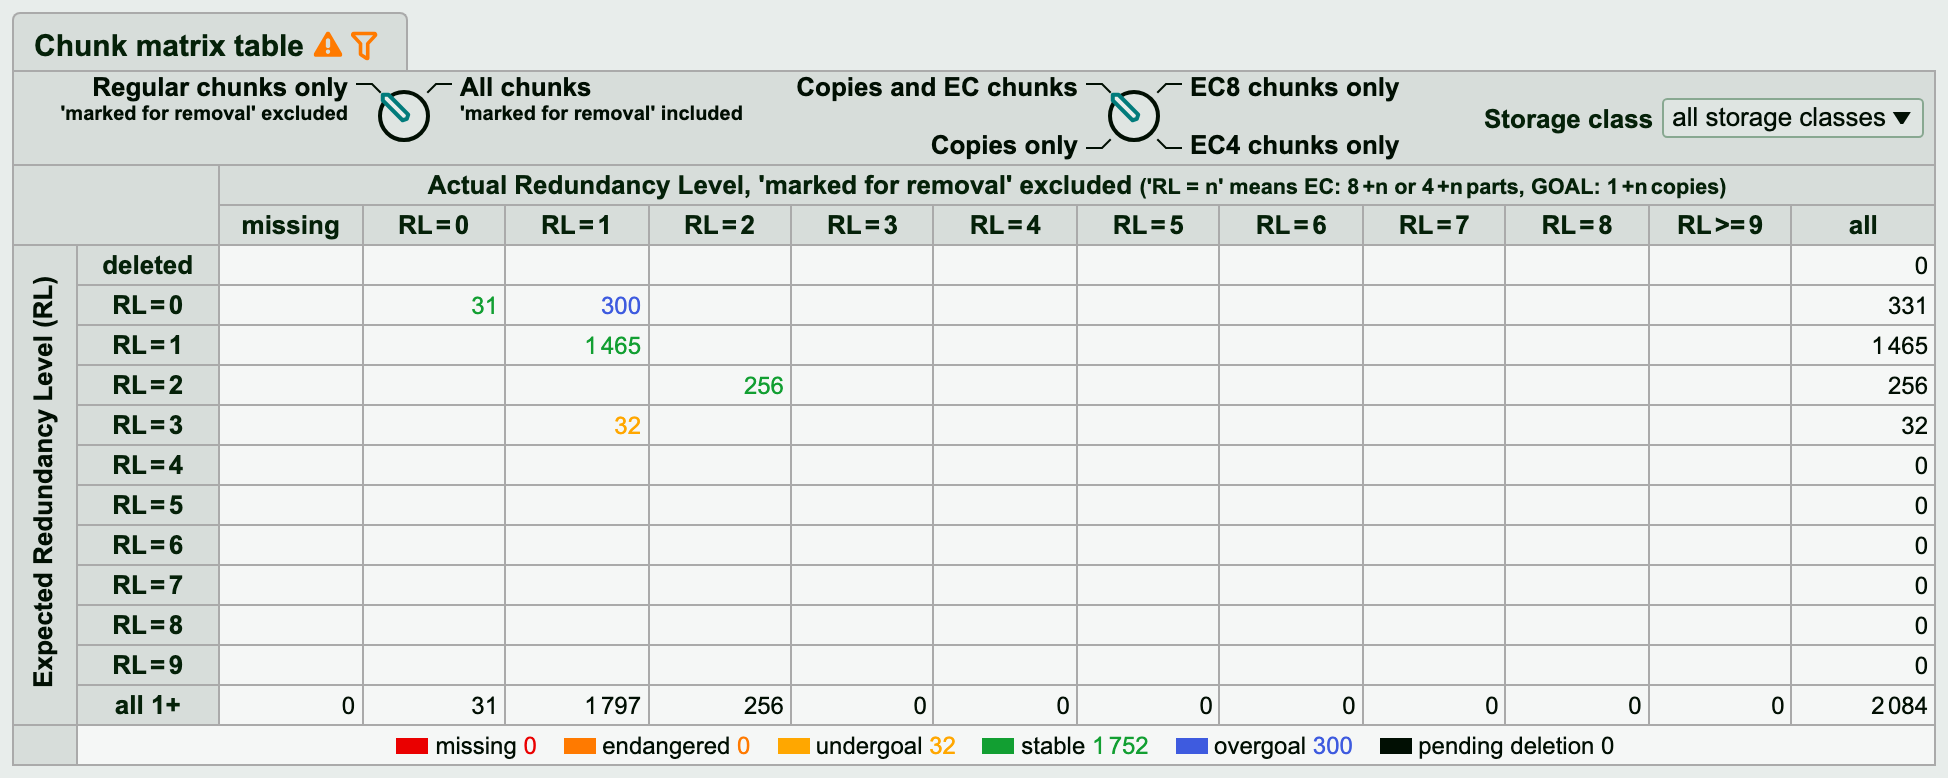
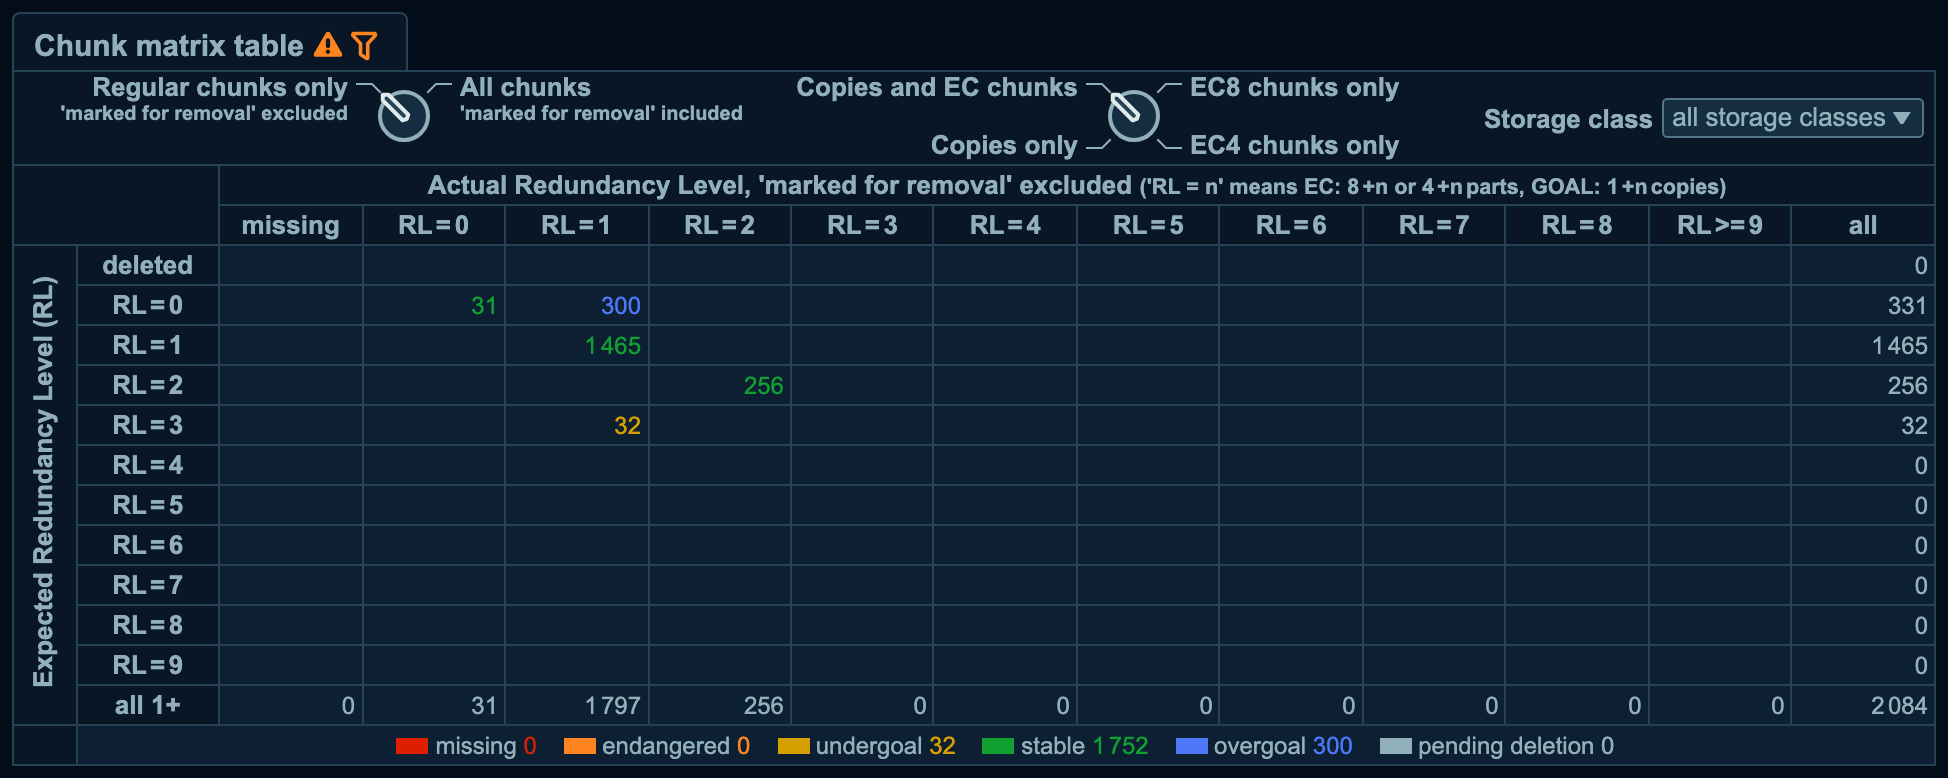
The chunk matrix of a cluster with something to show off the diagonal: a block short of redundancy to the left of it, and a block with more than its class requires to the right. Four expected levels run down the side. The knobs above the table decide which chunks the table counts. The legend under the table repeats the same totals grade by grade.
- The rows are labeled with the expected level. The first row,
deleted, holds the chunks that no file references any more. The rest runRL = 0throughRL = 9. The bottom row,all 1+, sums every row exceptdeleted. - The columns are labeled with the actual level. The first column,
missing, comes before level zero. Then comeRL = 0throughRL = 8, andRL >= 9, which includes level nine and everything above it. The last column,all, sums the row. The last level row is labeledRL = 9, but it includes level nine and above in the same way. - Both captions change wording with the chunk type:
Expected Redundancy Level (RL)againstActual Redundancy Levelwhen copies and Erasure Coding are counted together,Expected number of copiesagainstActual number of full copiesfor copies alone, and parts for one Erasure Coding width. The notation appears next to the header in small print:('RL = n' means EC: 8 + n or 4 + n parts, GOAL: 1 + n copies). - On the diagonal, expected and actual agree. A healthy cluster therefore has its chunks on the diagonal and in the
deletedrow. To the left of the diagonal the chunks are short of redundancy. To the right, the chunks have more than the class requires. - Under the table the same totals appear as a legend, one entry per grade, in the order
missing,endangered,undergoal,stable,overgoal, andpending deletion.
Knobs above the table decide which chunks the table counts. A knob that is narrowing the view puts a funnel icon next to the title.
- Chunk scope:
Regular chunks only, marked'marked for removal' excluded, is the position the table opens in.All chunks, marked'marked for removal' included, is the other position. The same words appear in the table header, so the printed table shows which of the two positions it uses. - Chunk type:
Copies and EC chunksis the opening position.EC8 chunks only,EC4 chunks only, andCopies onlynarrow it. With a Master Server that reports the older matrix, the positions areCopies and EC chunks,Copies only, andEC chunks only. - Storage Class:
All storage classes, or one class at a time. It appears as a knob for a few classes and as a drop-down list once there are more of them or once a name runs long.
A cluster with more than one location PRO (PRO Edition only) adds a corner header saying All locations, or Location and the name.
While Chunkservers are connecting or disconnecting, a line above the table says Counters may not be valid - connections and disconnections in progress, in variants naming one direction or both. Counters read during that time describe a set of copies that is still changing.
The Queue state column names the queue's work
The Chunkservers tab has two columns about load. Queue is that Chunkserver's load figure: busy worker threads plus tasks waiting in the queue, counted across both of its worker pools. Queue state names what the queue is doing. The column takes one of five values.
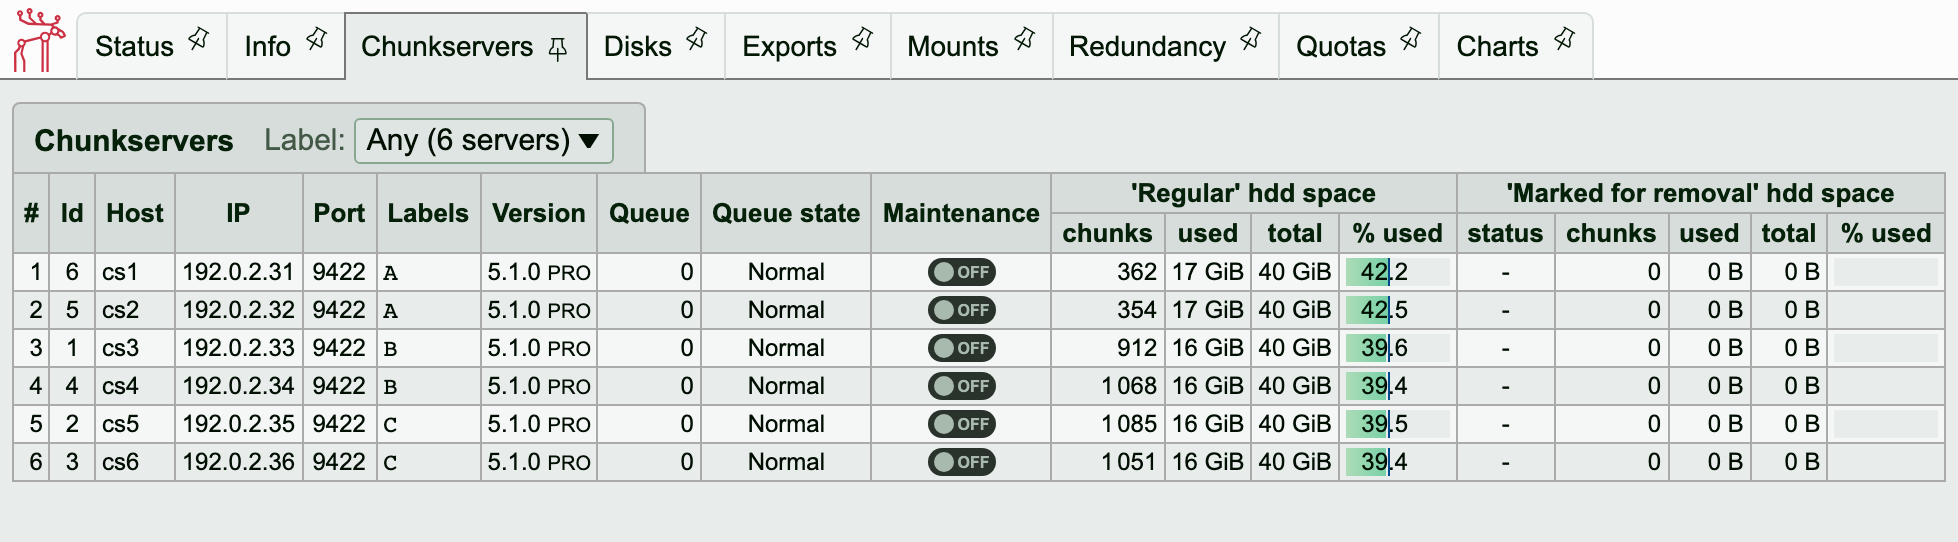
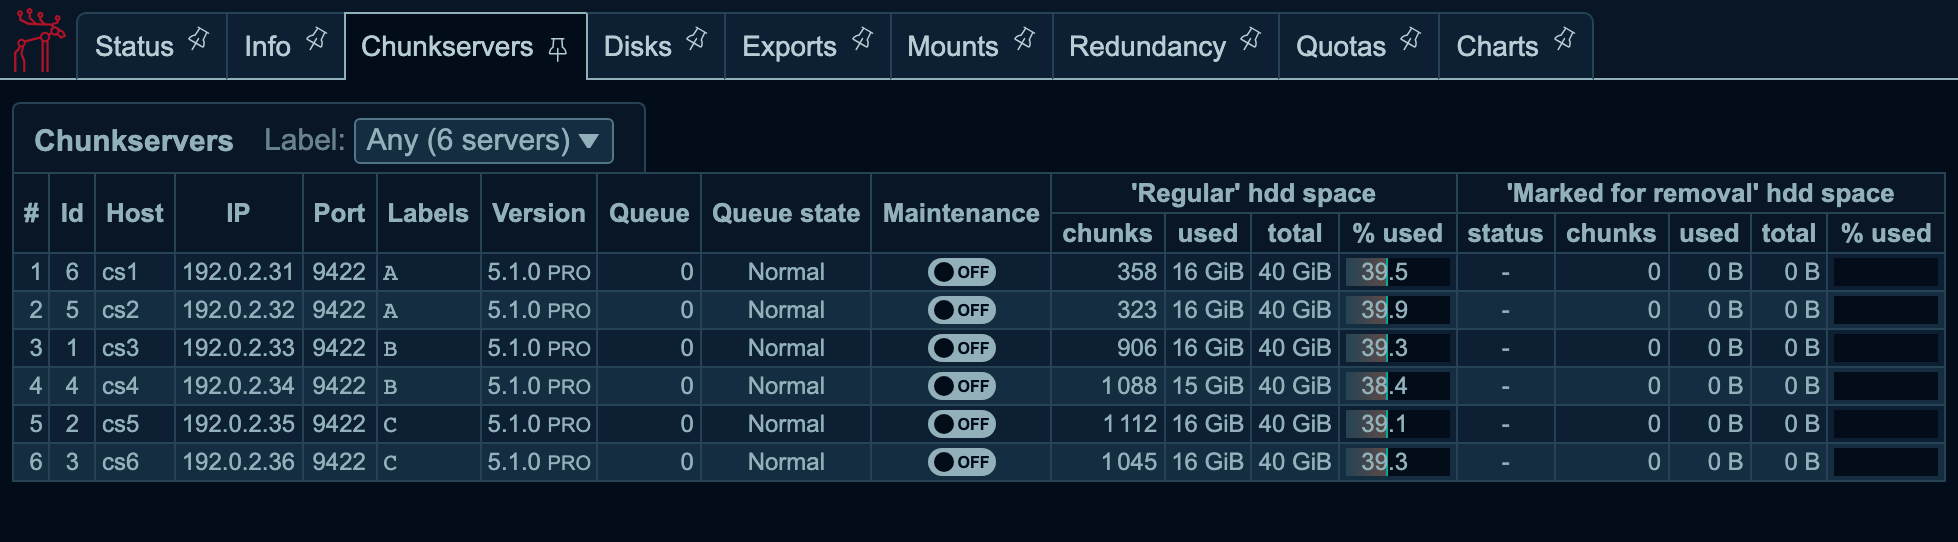
The Chunkservers tab. Queue counts the tasks waiting. Queue state names what the queue is doing. The Label: list above the table narrows the table to the servers carrying one label.
Queue state | What it means |
|---|---|
Normal | The server is responsive and working under low load |
Overloaded | The Chunkserver has reported its own working queue as heavily loaded |
Rebalance | The Chunkserver is moving chunks between its own disks at the background rate |
Fast rebalance | The same at full speed. The value carries a link, but the link sends the back to work command (mfscli -CBW/<ip>/<port>), which only clears the Master Server's heavy-load timestamp, the timestamp behind G(n). The command neither stops the rebalance, which the Chunkserver runs on its own, nor changes this column |
G(n) | The Master Server found this server heavily loaded next to the other servers, and n counts the seconds left in its grace period. Only a Chunkserver that reports no load of its own reaches this state, and none built since 3.0.7 is such a server |
The same states appear on the Status tab under Queue: on each server tile, with the wording Normal load, Overloaded, Rebalancing, Fast rebalancing, and <n> secs graceful. Only Overloaded raises an alert, which the GUI marks on the server. Both rebalance states are ordinary work and raise nothing. What each of them changes for the cluster is covered in rebalancing.
An overloaded Chunkserver takes nothing until it drains
Overloaded and G(n) come from two different places and clear for different reasons.
A Chunkserver reports Overloaded about itself. It keeps two pools of worker threads, one for high priority work and one for low, both sized by WORKERS_MAX in mfschunkserver.cfg. One pool passing its high mark is enough to raise the state. Both pools have to fall below the low mark to clear it, so the state outlasts the spike that raised it. Allocation and space selection explains where the two marks are. A change of state reaches the Master Server at once. The queue length that produces the state is reported every second in any case.
G(n) is the Master Server's own assessment. The Master Server does not consult the Chunkserver. The assessment applies to one kind of server only. That kind is no longer built. A Chunkserver of 3.0.7 or newer reports its own load, and that report decides its state: such a server reads Normal or Overloaded, never G(n). The Master Server used the assessment before those reports existed. The Master Server keeps the assessment for a Chunkserver that sends no reports, that is, a Chunkserver older than 3.0.7. A cluster that mixes versions that far apart is outside the chain that this documentation supports (version compatibility). G(n) is therefore a state that a current cluster does not show.
Where the assessment does apply, the Master Server makes it by comparison. Each load report is measured against the average load of the other connected Chunkservers. A server above CS_HEAVY_LOAD_THRESHOLD and at the same time above CS_HEAVY_LOAD_RATIO_THRESHOLD times that average enters a grace period of CS_HEAVY_LOAD_GRACE_PERIOD seconds, 900 by default. The Master Server logs the load, both thresholds, and the average it compared against. Every further detection restarts the clock, so G(n) counts down only while no new detection occurs. The three options are in mfsmaster.cfg. They control nothing else.
The two states do not have the same effect on the server. New chunks avoid an overloaded server outright. The allocation only passes over a server in its grace period (allocation and space selection). Servers in both states are left out of ordinary repairs under replication priorities. A cluster whose servers spend their time in these states therefore places and repairs data on fewer machines than it has.
When the state keeps returning, the setting to change on the Chunkserver side is WORKERS_MAX. Both marks are fractions of that limit, so raising the limit raises the point at which the server reports itself as overloaded. Raising the limit adds queue depth, not speed. The alert that the cluster raises for this state says what to examine first: errors on the disks and disproportionately long I/O times, and load from other processes. The alert also points at whether the server is older or slower than its peers. The full wording is in Alerts. The history of the column is in the chart max number operations waiting in queue, under Charts and then Chunkservers.
The Maintenance column says who set the mode and how long it holds
Maintenance is a switch as well as a reading: clicking it on a connected Chunkserver turns maintenance mode on or off for that server. The column's reading depends on which of the two modes the server is in. The two modes also end in different ways.
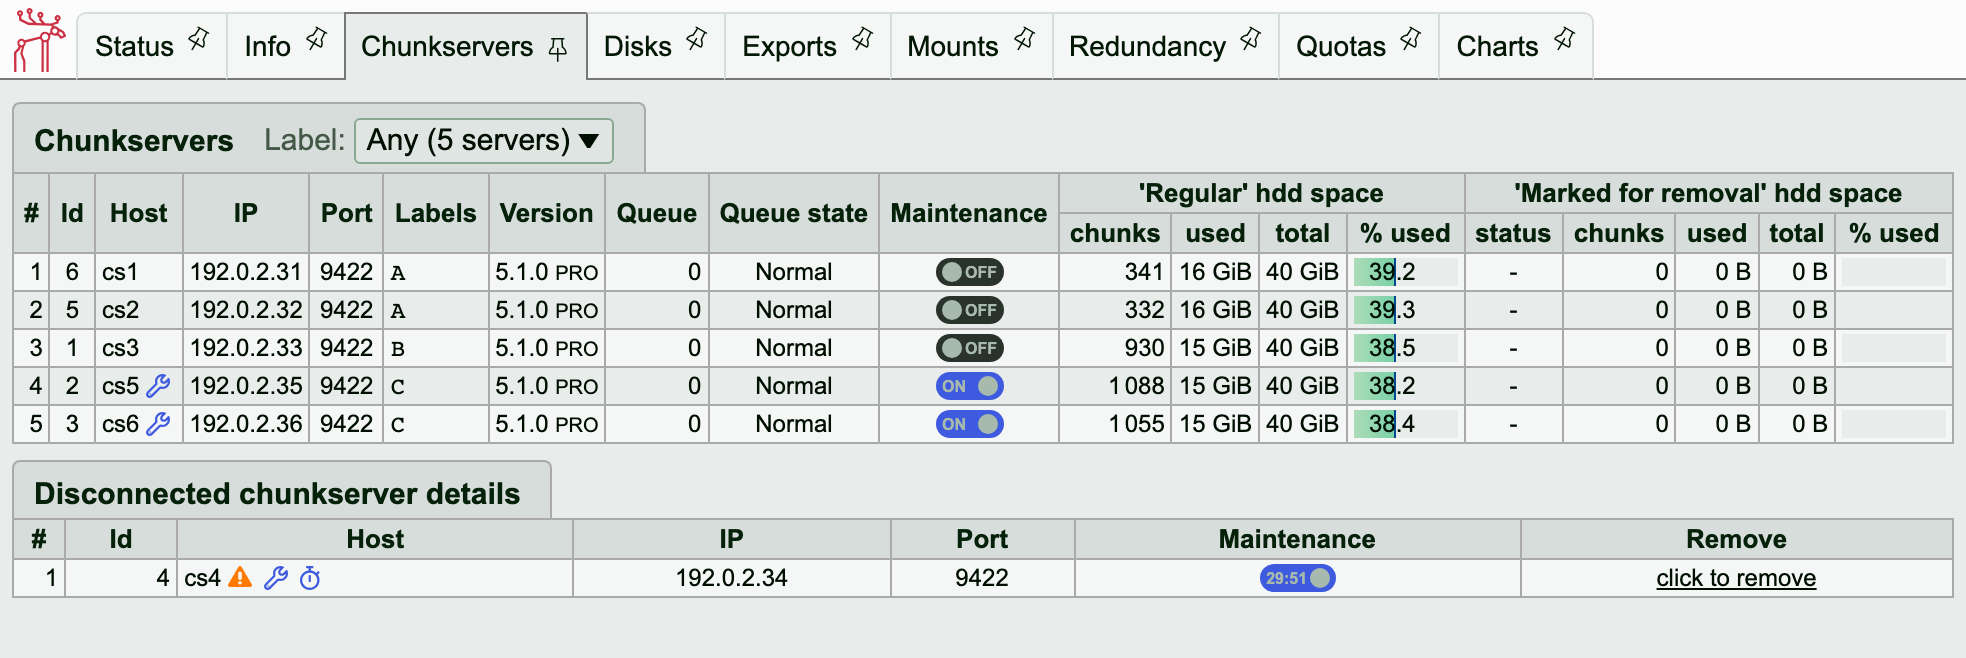
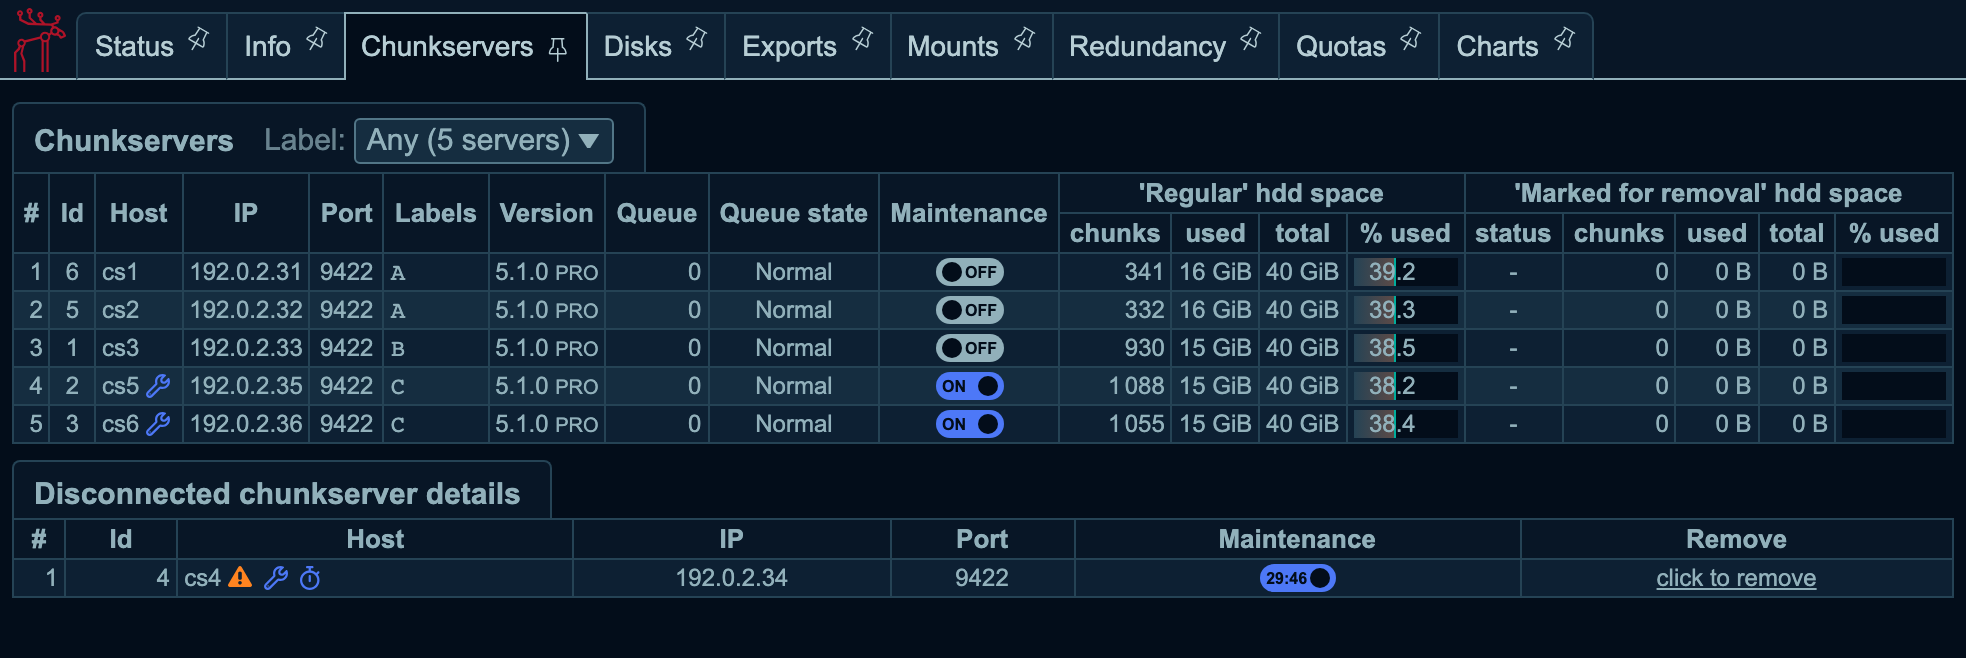
Two Chunkservers put into maintenance mode by hand read ON and stay there. The third was stopped in a controlled way and has moved from the upper table to Disconnected chunkserver details. Its Maintenance column counts down the time that the cluster still waits for it.
OFFis the ordinary state. The switch turns maintenance mode on.ONis maintenance mode that you set, from this switch or frommfscli -CM1/<ip>/<port>. A server in this mode keeps it through a restart and through a reconnection after an outage. The mode ends when you turn the switch off, or when the time limit set byCS_MAINTENANCE_MODE_TIMEOUTruns out. The packaged default of 0 sets no limit, so by default the mode has no time limit.TMPis temporary maintenance mode, which the server enters by itself. When you stop a Chunkserver in a controlled way, withmfschunkserver stopor the systemd unit, the Chunkserver announces its departure to the Master Server. The Master Server then waits instead of rebuilding what the Chunkserver holds. When the Chunkserver reconnects, the mode clears without any action from you.
The countdown is part of temporary maintenance mode. A disconnected server in temporary maintenance mode is listed in the Disconnected chunkserver details table underneath. Its Maintenance column shows the time left instead of a word. The figure counts down in minutes and seconds. The column counts down to CS_TEMP_MAINTENANCE_MODE_TIMEOUT in mfsmaster.cfg, which is 30 minutes from the stop by default. At zero, the Master Server stops treating the absence as planned and starts replicating what the server held. A disconnected server under manual maintenance reads ON in the same column and shows no countdown. This difference matters when you decide whether the cluster is about to start rebuilding.
Either mode affects more than that one server. What the mode suspends across the rest of the cluster is covered in maintenance mode.
The operations table opens on the closed hour
Operations, under Mounts, counts the file system calls that each connected client made, one column per call and a total at the end. The knob above the table chooses which hour the table counts. The knob opens on Last hour, which is the hour that ended at the last full hour, not the last sixty minutes. Current hour is the hour in progress. Its counters start again from zero at every full hour. A job running now therefore appears under Current hour and is absent from the table that the tab opens with. Both numbers appear in the tooltip of every cell, so one hover tells you which hour you are looking at.


The Operations table under Mounts, with one column per file system call. The knob above it chooses between the hour that has closed and the hour in progress.
One click dismisses a disk error
The last error column gives the time of the last error the Chunkserver recorded on that disk, no errors when there is none, and - for a disk that the Chunkserver has no data about. The time is a link that dismisses the error. The link appears only when three conditions hold together: the GUI is not in the read-only display mode, the disk is not already marked as damaged, and the Chunkserver runs at least version 4.33.0. If the disk is damaged or the Chunkserver is too old, the value shows the reason instead of the link. In the read-only display mode, the value is not a link at all. Its tooltip then gives only the time and the chunk. Dismissing an error changes nothing about the disk itself. Disk error handling and disk removal covers what the Chunkserver counts and when it drops a disk from service.
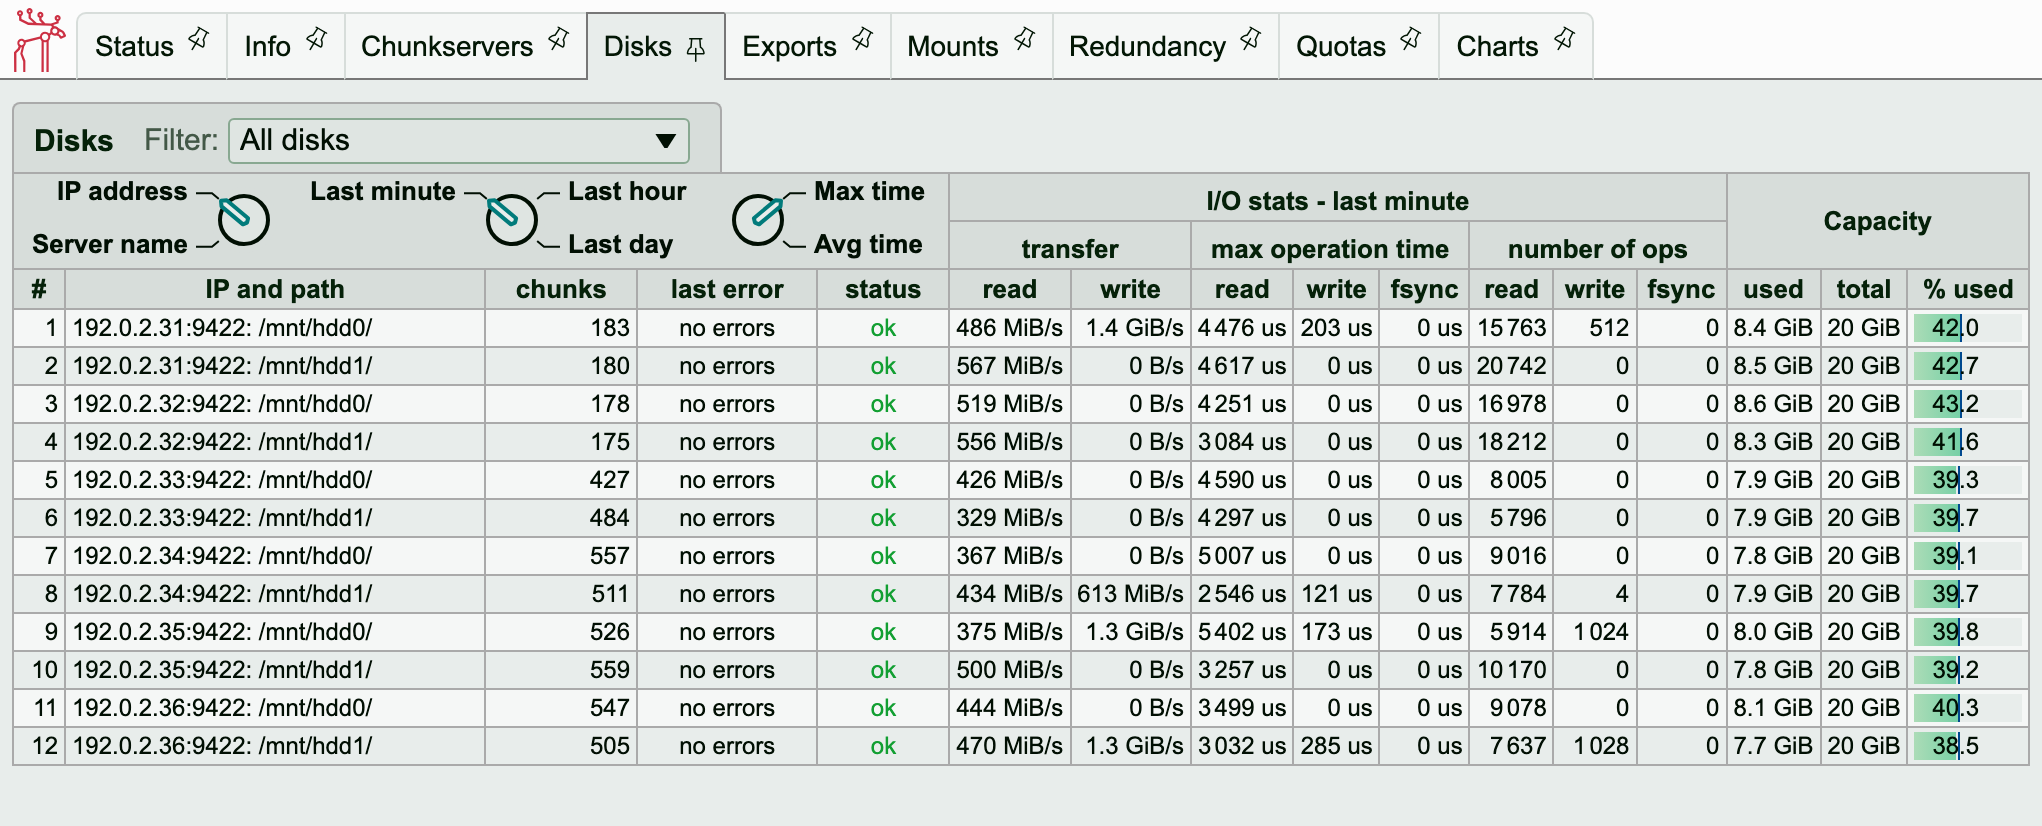
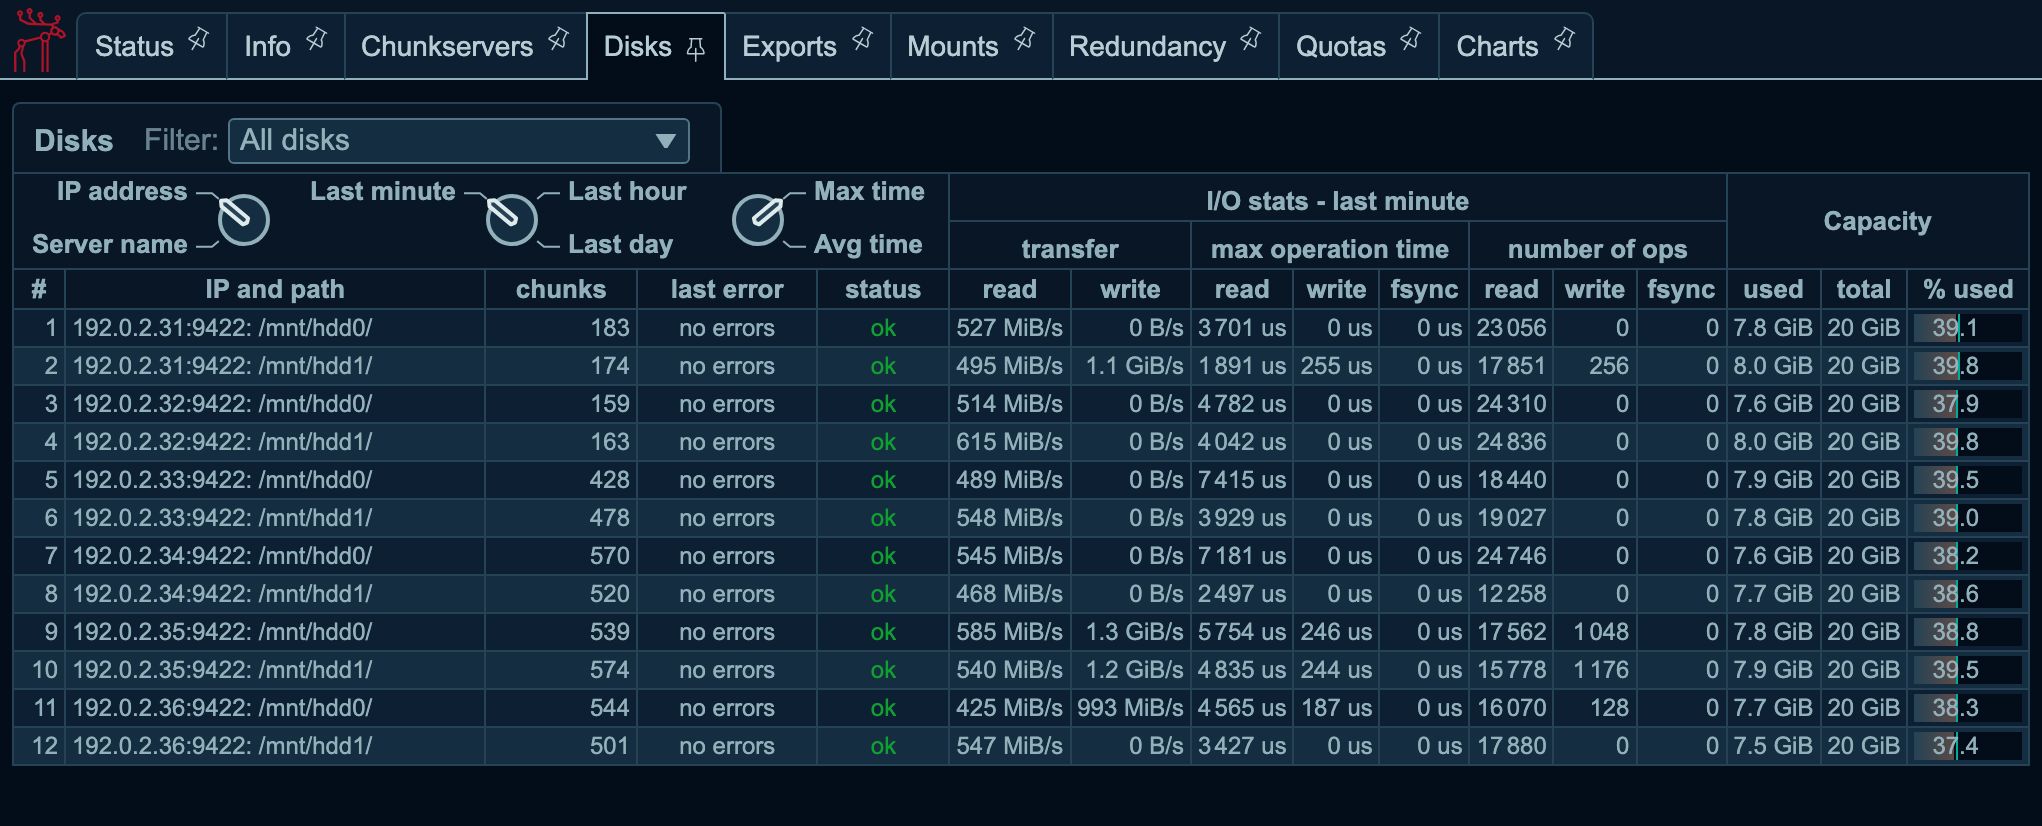
The Disks tab with every disk of the cluster listed. last error reads no errors here. Where an error is shown, the time itself is the link that dismisses the error.
The GUI draws what the command line prints
The GUI and the command line are built on one set of sections and use the same names for them. The same reading is therefore available in both. Two things exist in only one of them. The Status drawing and the drawn charts have no counterpart on the command line. In the other direction, acquired locks are a separate section on the command line, but the GUI includes them in Open files and locks.
What to watch explains which readings need attention, and how often. The wording of every mark that the GUI puts on a value is in Alerts. The same server answers the metrics endpoint, whose values are named in Metrics.